Food Lion 2009 Annual Report Download - page 65
Download and view the complete annual report
Please find page 65 of the 2009 Food Lion annual report below. You can navigate through the pages in the report by either clicking on the pages listed below, or by using the keyword search tool below to find specific information within the annual report.-
 1
1 -
2
-
3
-
4
-
5
-
6
-
7
-
8
-
9
-
10
-
11
-
12
-
13
-
14
-
15
-
16
-
17
-
18
-
19
-
20
-
21
-
22
-
23
-
24
-
25
-
26
-
27
-
28
-
29
-
30
-
31
-
32
-
33
-
34
-
35
-
36
-
37
-
38
-
39
-
40
-
41
-
42
-
43
-
44
-
45
-
46
-
47
-
48
-
49
-
50
-
51
-
52
-
53
-
54
-
 55
55 -
 56
56 -
 57
57 -
 58
58 -
 59
59 -
 60
60 -
 61
61 -
 62
62 -
 63
63 -
 64
64 -
 65
65 -
 66
66 -
 67
67 -
 68
68 -
 69
69 -
 70
70 -
 71
71 -
 72
72 -
 73
73 -
 74
74 -
 75
75 -
76
-
77
-
78
-
79
-
80
-
81
-
82
-
83
-
84
-
85
-
86
-
87
-
88
-
89
-
90
-
91
-
92
-
93
-
94
-
95
-
96
-
97
-
98
-
99
-
100
-
101
-
102
-
103
-
104
-
105
-
106
-
107
-
108
-
109
-
110
-
111
-
112
-
113
-
114
-
115
-
116
-
117
-
118
-
119
-
120
-
121
-
122
-
123
-
124
-
125
-
126
-
127
-
128
-
129
-
130
-
131
-
132
-
133
-
134
-
135
-
136
-
137
-
138
-
139
-
140
-
141
-
142
-
143
-
144
-
145
-
146
-
147
-
148
-
149
-
150
-
151
-
152
-
153
-
154
-
155
-
156
-
157
-
158
-
159
-
160
-
161
-
162
-
163
 |
 |
61
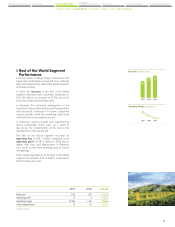
Performance Cash Grant
The long-term incentive plan includes a
component which can result in a cash
payment in the period following a three-
year performance period. The value of the
performance cash award granted each year,
referred to as the “target award,” is based on
the face value of the award at the time of the
grant, i.e., at the beginning of each three-year
period. For example, the payment done in
2009 is based on achievements against targets
set in 2006. The amount of the cash payment
at the end of the three-year performance
period is dependent on performance by the
Company against Board-approved financial
targets for return on invested capital (“ROIC”)
and compound annual revenue growth. These
metrics are key performance indicators which
the Company considers to be closely correlated
to building long-term shareholder value. The
relative weight for these metrics is 70% for ROIC
and 30% for revenue growth.
The Company sets these targets each year
based upon its growth expectations for the
ensuing three-year performance period.
Participants receive the “target award” in cash
if the performance targets are achieved. Cash
payments are reduced for performance below
the targets and are increased if performance
exceeds the targets. The Board of Directors
determines the performance target goals every
year. These performance target goals include
minimum threshold performance goals below
which no cash payment will occur, and the
maximum award levels if the performance
targets are exceeded.
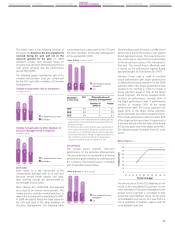
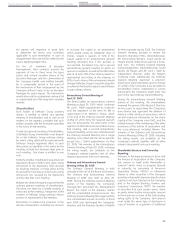
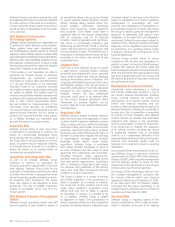
Participants may receive up to 150% of the
target cash award if actual performance
reaches or exceeds 120% of the performance
targets for both ROIC and revenue growth. At
the end of each three-year period, actual ROIC
and revenue growth are measured against the
performance targets for both metrics and the
actual payout is calculated. The cash payment
occurs in the year following the end of the three-
year period. For example, the amounts paid in
2009 relate to the achievement of the goals
determined for the period 2006-2008. This
principle is illustrated in the following graph.
Payout Range (in %)
Resulting Payout
Performance (as a % of Target)
160
140
120
100
80
60
40
20
0
80 85 90 95 100 105 110 115 120 125 130 135 140
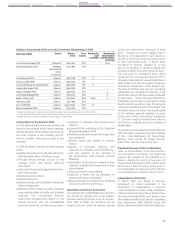
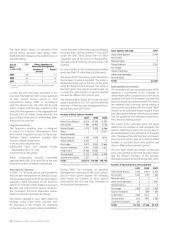
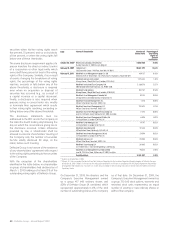
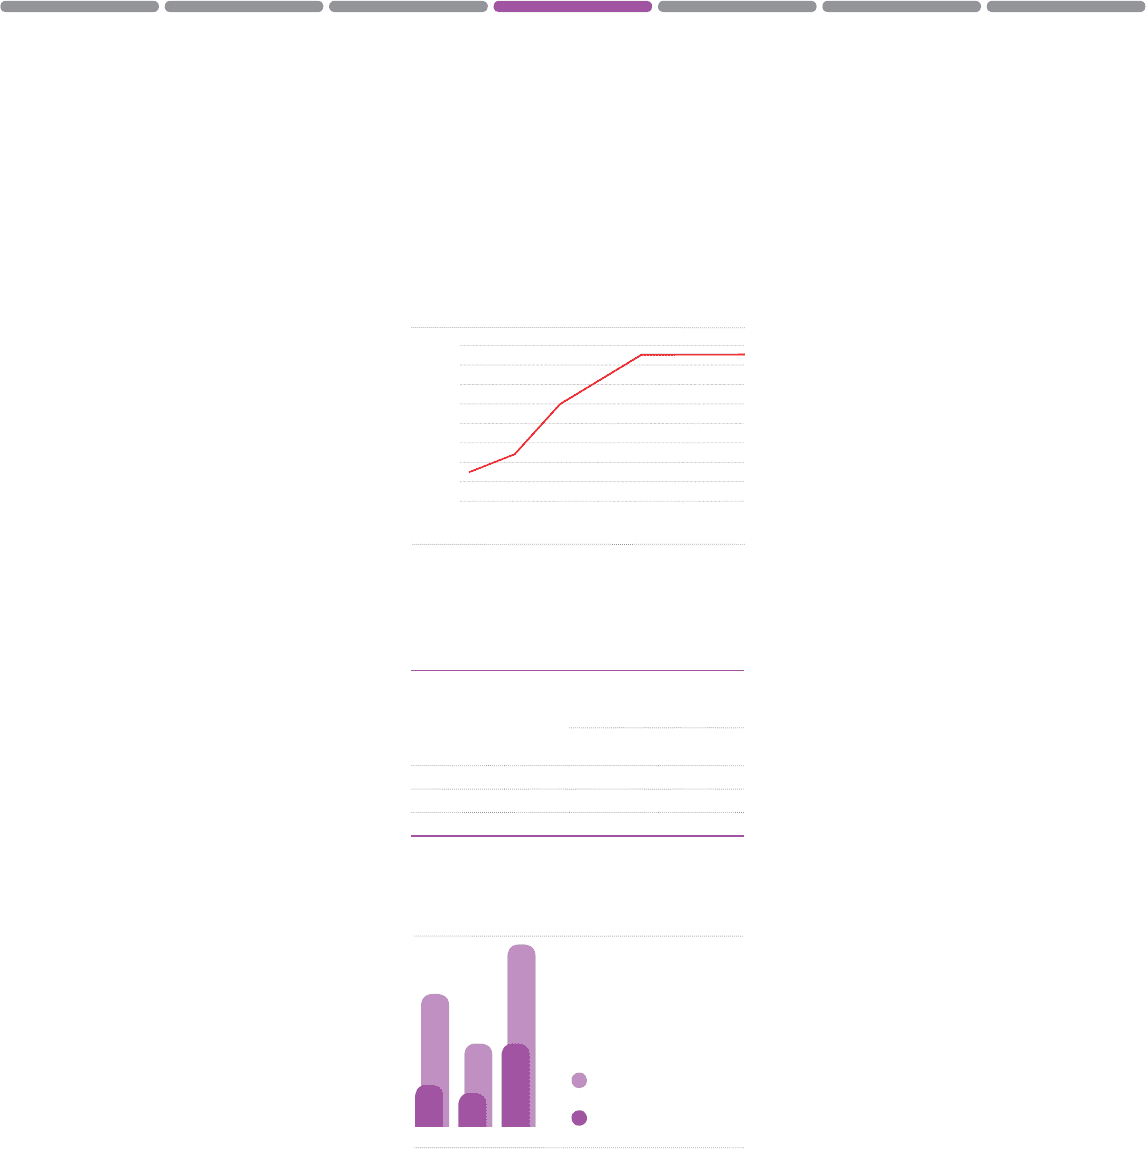
The following table shows the amounts paid
in the years 2007-2009 for the performance
over the respective periods 2004-2006,
2005-2007 and 2006-2008.
Performance
Cash Grant
(1)
(in millions of EUR)
CEO
Others Members of
Executive Management
Payout(2) Number of
persons Payout(2)
2009
1.0 7 2.2
2008
0.4 7 1.0
2007
0.5 9 1.6
(1)
Amounts are gross before deduction of withholding taxes and social
security levy.
(2) Payout in year N for the performance of the previous 3 years.
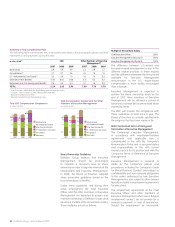
Other Members of Executive
Management
CEO
Performance Cash Grant (in millions of EUR)
2007 2008 2009
1.6
0.5
1.0
0.4
2.2
1.0
Other Benefits, Retirement and Post-employment
Benefits
Other benefits include the use of company-
provided transportation, employee and
dependent life insurance, welfare benefits
and an allowance for financial planning for
U.S. members of the Executive Management.
Delhaize Group believes these benefits are
appropriate for Executive Management’s
responsibilities and believes these are
consistent with the Group’s philosophy and
culture and market practices.
DELHAIZE GROUP AT A GLANCE
OUR STRATEGY OUR ACTIVITIES IN 2009 CORPORATE
GOVERNANCE STATEMENT RISK FACTORS FINANCIAL STATEMENTS
SHAREHOLDER INFORMATION
The members of Executive Management
benefit from corporate pension plans, which
vary regionally. The European members
participate in a defined benefit group
insurance plan. This European plan is
contributory and based on the individual’s
career length with the Company. U.S. members
of Executive Management participate in
pension plans and defined benefit plans at
their respective operating companies. During
the year 2010, the members of Executive
Management will be offered the option to
participate in the defined contribution plan, or
continue the current defined benefit plan. The
amounts paid by the Company are included in
the summary table on page 62.