Food Lion 2009 Annual Report Download - page 141
Download and view the complete annual report
Please find page 141 of the 2009 Food Lion annual report below. You can navigate through the pages in the report by either clicking on the pages listed below, or by using the keyword search tool below to find specific information within the annual report.-
 1
1 -
2
-
3
-
4
-
5
-
6
-
7
-
8
-
9
-
10
-
11
-
12
-
13
-
14
-
15
-
16
-
17
-
18
-
19
-
20
-
21
-
22
-
23
-
24
-
25
-
26
-
27
-
28
-
29
-
30
-
31
-
32
-
33
-
34
-
35
-
36
-
37
-
38
-
39
-
40
-
41
-
42
-
43
-
44
-
45
-
46
-
47
-
48
-
49
-
50
-
51
-
52
-
53
-
54
-
55
-
56
-
57
-
58
-
59
-
60
-
61
-
62
-
63
-
64
-
65
-
66
-
67
-
68
-
69
-
70
-
71
-
72
-
73
-
74
-
75
-
76
-
77
-
78
-
79
-
80
-
81
-
82
-
83
-
84
-
85
-
86
-
87
-
88
-
89
-
90
-
91
-
92
-
93
-
94
-
95
-
96
-
97
-
98
-
99
-
100
-
101
-
102
-
103
-
104
-
105
-
106
-
107
-
108
-
109
-
110
-
111
-
112
-
113
-
114
-
115
-
116
-
117
-
118
-
119
-
120
-
121
-
122
-
123
-
124
-
125
-
126
-
127
-
128
-
129
-
130
-
 131
131 -
 132
132 -
 133
133 -
 134
134 -
 135
135 -
 136
136 -
 137
137 -
 138
138 -
 139
139 -
 140
140 -
 141
141 -
 142
142 -
 143
143 -
 144
144 -
 145
145 -
 146
146 -
 147
147 -
 148
148 -
 149
149 -
 150
150 -
 151
151 -
152
-
153
-
154
-
155
-
156
-
157
-
158
-
159
-
160
-
161
-
162
-
163
 |
 |

137
SUMMARY STATUTORY ACCOUNTS
OF DELHAIZE GROUP SA
HISTORICAL FINANCIAL OVERVIEW CERTIFICATION OF RESPONSIBLE
PERSONS
REPORT OF THE STATUTORY AUDITOR
SUPPLEMENTARY INFORMATION
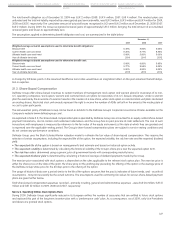
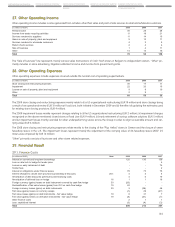
31. Earnings Per Share (“EPS”)
Basic earnings per share is calculated by dividing the profit attributable to equity holders of the Group by the weighted average number of
ordinary shares outstanding during the year, excluding ordinary shares bought by the Group and held as treasury shares (see Note 16).
Diluted earnings per share is calculated by adjusting the weighted average number of ordinary shares outstanding to assume conversion of
all dilutive potential ordinary shares. Until April 2009, the Group had two categories of dilutive potential ordinary shares. As explained in Note
18.1, the convertible debt was reimbursed without any conversion:
tConvertible Debt: the convertible debt is assumed to have been converted into ordinary shares and the net profit is adjusted to eliminate
the interest expense less the tax effect.
tShare-based Awards: the dilutive share-based awards are assumed to have been exercised, and the assumed proceeds from these
instruments are regarded as having been received from the issue of ordinary shares at the average market price of ordinary shares during
the period. The difference between the number of ordinary shares issued and the number of ordinary shares that would have been issued
at the average market price of ordinary shares during the period is treated as an issue of ordinary shares for no consideration.
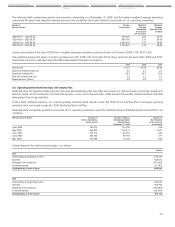
Approximately 2 752 075, 2 549 989 and 737 998 shares attributable to the exercise of outstanding stock options and warrants were
excluded from the calculation of diluted earnings per share for the years ended December 31, 2009, 2008 and 2007, respectively, as their
effect was anti-dilutive.
The computation of basic and diluted earnings per share for the years ended December 31, 2009, 2008 and 2007 is as follows:
(in millions of EUR, except numbers of shares and earnings per share) 2009 2008 2007
Net profit from continuing operations 512 485 401
Net profit from continuing operations attributable to non-controlling interests 6 12 15
Group share in net profit from continuing operations 506 473 386
Interest expense on convertible bond, net of tax 2 6 7
Group share in net profit from continuing operations for diluted earnings 508 479 393
Result from discontinued operations, net of tax 8 (6) 24
Group share in net profit for diluted earnings 516 473 417
Weighted average number of ordinary shares outstanding 99 802 736 99 385 055 97 666 467
Adjusted for:
Dilutive effect of share-based awards 791 992 750 485 1 800 979
Dilutive effect of convertible bond 979 341 2 995 630 3 981 052
Weighted average number of diluted ordinary shares outstanding 101 574 069 103 131 170 103 448 498
Basic earnings per ordinary share (in EUR):
From continuing operations 5.07 4.76 3.95
From discontinuing operations 0.09 (0.06) 0.25
Basic EPS attributable to the equity holder of the Group 5.16 4.70 4.20
Diluted earnings per ordinary share (in EUR):
From continuing operations 5.00 4.65 3.80
From discontinuing operations 0.08 (0.06) 0.24
Diluted EPS attributable to the equity holder of the Group 5.08 4.59 4.04
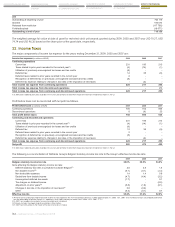
32. Related Party Transactions
Several of the Group’s subsidiaries provide post-employment benefit plans for the benefit of employees of the Group. Payments made to these
plans and receivables from and payables to these plans are disclosed in Note 21.
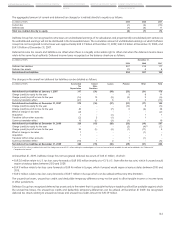
The Company’s Remuneration Policy for Directors and the Executive Management can be found as Exhibit E to the Corporate Governance
Charter posted on the Company’s website at www.delhaizegroup.com.
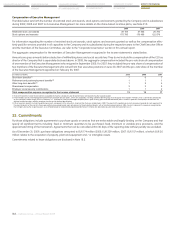
Compensation of Directors
The individual Directors’ remuneration granted for the fiscal years 2009, 2008 and 2007 is set forth in the Corporate Governance section of this
annual report. The total remuneration of Directors is as follows, gross before deduction of withholding taxes:
(in thousands of EUR) 2009 2008 2007
Total remuneration non-executive Directors 1 000 969 864
Executive Director
Pierre-Olivier Beckers(1) 80 80 75
Total 1 080 1 049 939
(1) The amounts solely relate to the remuneration of the Executive Director and excludes his compensation as CEO.