Food Lion 2009 Annual Report Download - page 63
Download and view the complete annual report
Please find page 63 of the 2009 Food Lion annual report below. You can navigate through the pages in the report by either clicking on the pages listed below, or by using the keyword search tool below to find specific information within the annual report.-
 1
1 -
2
-
3
-
4
-
5
-
6
-
7
-
8
-
9
-
10
-
11
-
12
-
13
-
14
-
15
-
16
-
17
-
18
-
19
-
20
-
21
-
22
-
23
-
24
-
25
-
26
-
27
-
28
-
29
-
30
-
31
-
32
-
33
-
34
-
35
-
36
-
37
-
38
-
39
-
40
-
41
-
42
-
43
-
44
-
45
-
46
-
47
-
48
-
49
-
50
-
51
-
52
-
 53
53 -
 54
54 -
 55
55 -
 56
56 -
 57
57 -
 58
58 -
 59
59 -
 60
60 -
 61
61 -
 62
62 -
 63
63 -
 64
64 -
 65
65 -
 66
66 -
 67
67 -
 68
68 -
 69
69 -
 70
70 -
 71
71 -
 72
72 -
 73
73 -
74
-
75
-
76
-
77
-
78
-
79
-
80
-
81
-
82
-
83
-
84
-
85
-
86
-
87
-
88
-
89
-
90
-
91
-
92
-
93
-
94
-
95
-
96
-
97
-
98
-
99
-
100
-
101
-
102
-
103
-
104
-
105
-
106
-
107
-
108
-
109
-
110
-
111
-
112
-
113
-
114
-
115
-
116
-
117
-
118
-
119
-
120
-
121
-
122
-
123
-
124
-
125
-
126
-
127
-
128
-
129
-
130
-
131
-
132
-
133
-
134
-
135
-
136
-
137
-
138
-
139
-
140
-
141
-
142
-
143
-
144
-
145
-
146
-
147
-
148
-
149
-
150
-
151
-
152
-
153
-
154
-
155
-
156
-
157
-
158
-
159
-
160
-
161
-
162
-
163
 |
 |
59
The tables used in the following sections of
this report are based on the actual payments
received during the year and not on the
amounts granted for the year, i.e., 2009
payments include cash received based on
annual bonus earned in 2008 and performance
cash grants received over the performance
period 2006-2008.
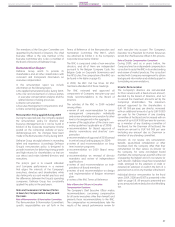
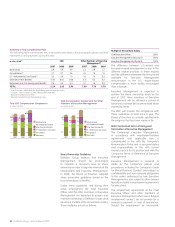
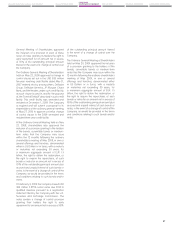
The following graphs illustrate the split of the
variable remuneration paid per component
for the CEO and other members of Executive
Management.
LTI - Performance Cash Grants
Annual Bonus
Variable Compensation CEO by Component
(in millions of EUR)
0.50.7
0.40.7
1.00.6
2007 2008 2009
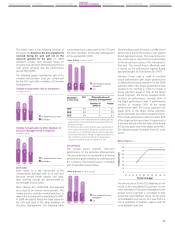
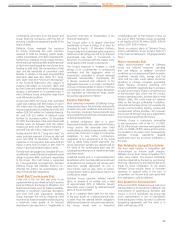
LTI - Performance Cash Grants
Annual Bonus
Variable Compensation to Other Members of
Executive Management by Component
(in millions of EUR)
1.61.8
1.01.8
2.21.4
2007 2008 2009
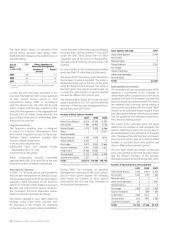
Base Salary
Base salary is a key component of the
compensation package, both on its own and
because annual target awards and long-
term incentive awards are denominated as
percentages of base salary.
Base salaries are established and adjusted
as a result of an annual review process. This
review process considers market practices. In
view of the economical circumstances the RNC
in 2009 decided to freeze the base salary for
the CEO and most of the other members of
Executive Management. The following table
summarizes base salary paid to the CEO and
the other members of Executive Management
for the period 2007-2009.
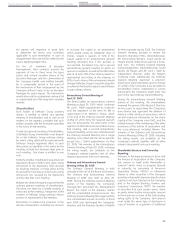
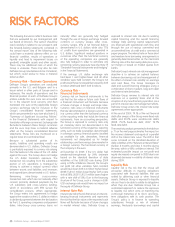
Other Members of Executive
Management
CEO
Base Salary (in millions of EUR)
2.9
2007 2008 2009
3.3
0.9
0.9
3.1
0.9
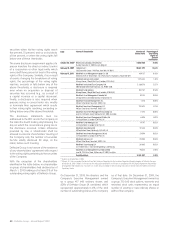
Base Salary
(1)
(in millions of EUR)
CEO
Others Members of
Executive Management
(2)
Number of
persons Payout
2009
0.9 7 3.1
2008
0.9 7 2.9
2007
0.9 9 3.3
(1) Amounts are gross amounts before deduction of withholding taxes and
social security levy. They do not include the compensation of the CEO as
director of the Company.
(2) For 2007 these numbers include the pro-rata share of compensation of
Arthur Goethals and Joyce Wilson-Sanford who retired from their Execu-
tive positions on June 30, 2007 and the pro-rata share of compensation
of the member of the Executive Management appointed on February 26,
2007. For 2008 they include the pro-rata share of compensation of
Craig Owens who left the Company on September 30, 2008.
Annual Bonus
The annual bonus rewards short-term
performance of the Executive Management.
The annual bonus is a cash award for achieving
performance goals related to the individual and
the Company. The annual bonus is a variable
part of executive compensation.
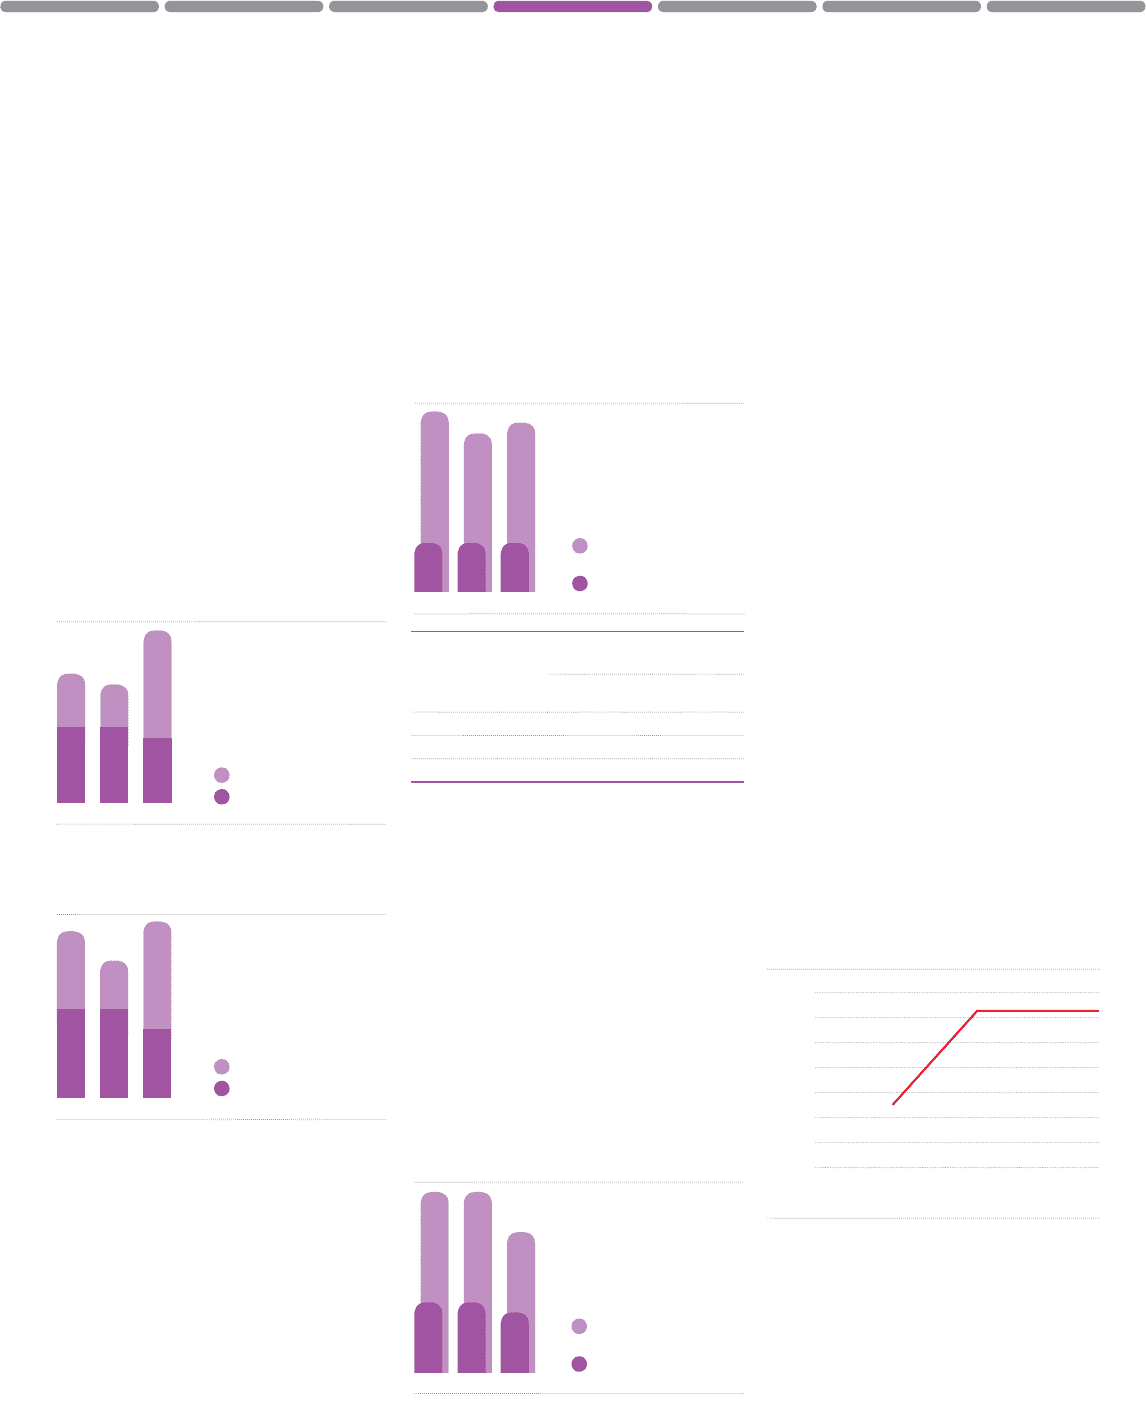
Other Members of Executive
Management
CEO
Annual Bonus (in millions of EUR)
2007 2008 2009
1.8
0.7
1.8
0.7
1.4
0.6
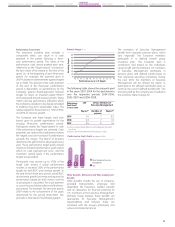
The annual bonus paid in a year is a reflection of
performance during the previous year against
Board approved targets. The target bonus for
the current year is expressed as a percentage
of the annual base salary of the individual for
that year. The annual bonus effectively paid
is based on the performance against Board
approved targets for Profit before Tax (“PBT”).
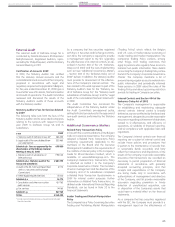
Delhaize Group uses a scale to correlate
actual performance with target performance
to determine the bonus payment. For the 2009
payment, 80% of the target performance level
needed to be reached in order to receive a
bonus payment equal to 50% of the target
bonus payment. The bonus payment levels
increase as performance exceeds 80% of
the target performance level. If performance
reaches or exceeds 110% of the target
performance level, the bonus payment will
equal 125% of the target bonus payment,
which represents the maximum payment level.
If the actual performance does not reach 80%
of the target performance level, the payment of
a bonus is entirely at the discretion of the Board
of Directors upon recommendation of the RNC.
The following graph illustrates how this scale
works.
Bonus Payout (in %)
Funding Percent
Percent to Budget
140
120
100
80
60
40
20
0
50 60 70 80 90 100 110 120 130 140 150
The annual bonus for the CEO depends on the
results at the consolidated Group level. For the
other members of Executive Management the
annual bonus payment is correlated to their
respective responsibilities. These can be at the
consolidated Group level or at a level that is a
mix of operating companies, regions and the
consolidated Group level.
DELHAIZE GROUP AT A GLANCE
OUR STRATEGY OUR ACTIVITIES IN 2009 CORPORATE
GOVERNANCE STATEMENT RISK FACTORS FINANCIAL STATEMENTS
SHAREHOLDER INFORMATION