Food Lion 2009 Annual Report Download - page 149
Download and view the complete annual report
Please find page 149 of the 2009 Food Lion annual report below. You can navigate through the pages in the report by either clicking on the pages listed below, or by using the keyword search tool below to find specific information within the annual report.-
 1
1 -
2
-
3
-
4
-
5
-
6
-
7
-
8
-
9
-
10
-
11
-
12
-
13
-
14
-
15
-
16
-
17
-
18
-
19
-
20
-
21
-
22
-
23
-
24
-
25
-
26
-
27
-
28
-
29
-
30
-
31
-
32
-
33
-
34
-
35
-
36
-
37
-
38
-
39
-
40
-
41
-
42
-
43
-
44
-
45
-
46
-
47
-
48
-
49
-
50
-
51
-
52
-
53
-
54
-
55
-
56
-
57
-
58
-
59
-
60
-
61
-
62
-
63
-
64
-
65
-
66
-
67
-
68
-
69
-
70
-
71
-
72
-
73
-
74
-
75
-
76
-
77
-
78
-
79
-
80
-
81
-
82
-
83
-
84
-
85
-
86
-
87
-
88
-
89
-
90
-
91
-
92
-
93
-
94
-
95
-
96
-
97
-
98
-
99
-
100
-
101
-
102
-
103
-
104
-
105
-
106
-
107
-
108
-
109
-
110
-
111
-
112
-
113
-
114
-
115
-
116
-
117
-
118
-
119
-
120
-
121
-
122
-
123
-
124
-
125
-
126
-
127
-
128
-
129
-
130
-
131
-
132
-
133
-
134
-
135
-
136
-
137
-
138
-
 139
139 -
 140
140 -
 141
141 -
 142
142 -
 143
143 -
 144
144 -
 145
145 -
 146
146 -
 147
147 -
 148
148 -
 149
149 -
 150
150 -
 151
151 -
 152
152 -
 153
153 -
 154
154 -
 155
155 -
 156
156 -
 157
157 -
 158
158 -
 159
159 -
160
-
161
-
162
-
163
 |
 |

145
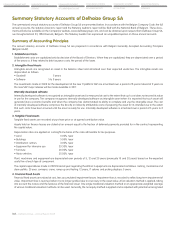
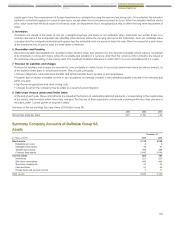
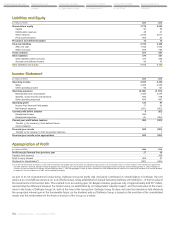
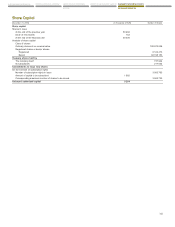
SUMMARY STATUTORY ACCOUNTS
OF DELHAIZE GROUP SA
HISTORICAL FINANCIAL OVERVIEW CERTIFICATION OF RESPONSIBLE
PERSONS
REPORT OF THE STATUTORY AUDITOR
SUPPLEMENTARY INFORMATION
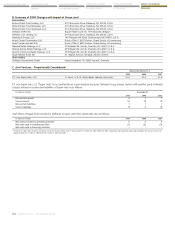
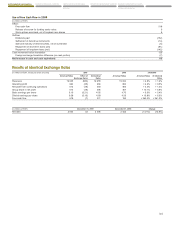
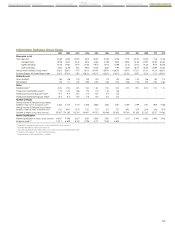
Use of Free Cash Flow in 2009
(in millions of EUR)
Inflow:
Free cash flow 518
Release of escrow for funding senior notes 5
Stock options exercised, net of buyback own shares 6
Outflow:
Dividends paid (152)
Settlement of derivative instruments (14)
Sale and maturity of debt securities, net of investment (5)
Repayment of short-term loans (net) (91)
Repayment of long-term loans (net) (142)
Cash movement before translation 125
Foreign exchange translation difference (on cash portion) (7)
Net increase in cash and cash equivalents 118
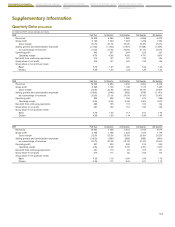
Results at Identical Exchange Rates
(in millions of EUR, except per share amounts) 2009 2008 2009/2008
At Actual Rates Effect of At Identical At Actual Rates At Actual Rates At Identical
Exchange Rates Rates Rates
Revenues 19 938 (680) 19 258 19 024 + 4.8% + 1.2%
Operating profit 942 (38) 904 904 + 4.2% + 0.0%
Net profit from continuing operations 512 (19) 493 485 + 5.5% + 1.4%
Group share in net profit 514 (19) 495 467 + 10.1% + 5.9%
Basic earnings per share 5.16 (0.21) 4.95 4.70 + 9.6% + 5.4%
Diluted earnings per share 5.08 (0.19) 4.89 4.59 + 10.8% + 6.6%
Free cash flow 518 (7) 511 150 + 245.2% + 241.0%
(in millions of EUR) December 31, 2009 December 31, 2008 Change
Net debt 2 063 33 2 096 2 402 (14.1%) (12.8%)