Food Lion 2009 Annual Report Download - page 109
Download and view the complete annual report
Please find page 109 of the 2009 Food Lion annual report below. You can navigate through the pages in the report by either clicking on the pages listed below, or by using the keyword search tool below to find specific information within the annual report.-
 1
1 -
2
-
3
-
4
-
5
-
6
-
7
-
8
-
9
-
10
-
11
-
12
-
13
-
14
-
15
-
16
-
17
-
18
-
19
-
20
-
21
-
22
-
23
-
24
-
25
-
26
-
27
-
28
-
29
-
30
-
31
-
32
-
33
-
34
-
35
-
36
-
37
-
38
-
39
-
40
-
41
-
42
-
43
-
44
-
45
-
46
-
47
-
48
-
49
-
50
-
51
-
52
-
53
-
54
-
55
-
56
-
57
-
58
-
59
-
60
-
61
-
62
-
63
-
64
-
65
-
66
-
67
-
68
-
69
-
70
-
71
-
72
-
73
-
74
-
75
-
76
-
77
-
78
-
79
-
80
-
81
-
82
-
83
-
84
-
85
-
86
-
87
-
88
-
89
-
90
-
91
-
92
-
93
-
94
-
95
-
96
-
97
-
98
-
 99
99 -
 100
100 -
 101
101 -
 102
102 -
 103
103 -
 104
104 -
 105
105 -
 106
106 -
 107
107 -
 108
108 -
 109
109 -
 110
110 -
 111
111 -
 112
112 -
 113
113 -
 114
114 -
 115
115 -
 116
116 -
 117
117 -
 118
118 -
 119
119 -
120
-
121
-
122
-
123
-
124
-
125
-
126
-
127
-
128
-
129
-
130
-
131
-
132
-
133
-
134
-
135
-
136
-
137
-
138
-
139
-
140
-
141
-
142
-
143
-
144
-
145
-
146
-
147
-
148
-
149
-
150
-
151
-
152
-
153
-
154
-
155
-
156
-
157
-
158
-
159
-
160
-
161
-
162
-
163
 |
 |
105
SUMMARY STATUTORY ACCOUNTS
OF DELHAIZE GROUP SA
HISTORICAL FINANCIAL OVERVIEW CERTIFICATION OF RESPONSIBLE
PERSONS
REPORT OF THE STATUTORY AUDITOR
SUPPLEMENTARY INFORMATION
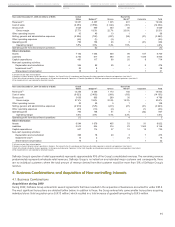
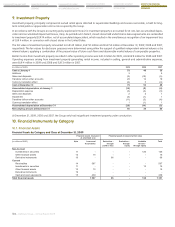
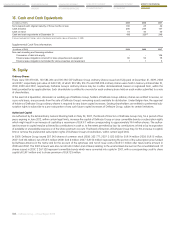
Financial Assets measured at fair value by Fair Value Hierarchy at December 31, 2009
Effective January 1, 2009, Delhaize Group adopted the amendment to IFRS 7 for financial instruments that are measured in the balance sheet
at fair value. This requires the disclosure of fair value measurements by level of the following fair value measurement hierarchy:
tLevel 1: The fair value of a financial instrument that is traded in an active market is measured based on quoted (unadjusted) prices for
identical assets or liabilities. A market is considered as active, if quoted prizes are readily and regularly available from an exchange, dealer,
broker, industry group, pricing service, or regulatory agency, and those prices represent actual and regularly occurring market transactions
on an arm’s length basis.
tLevel 2: The fair value of financial instruments that are not traded in an active market is determined by using valuation techniques. These
valuation techniques maximise the use of observable market date where it is available and rely as little as possible on entity specific esti-
mates. If all significant inputs required to fair value an instrument are observable, either directly (i.e. as prices) or indirectly (i.e. derived from
prices), the instrument is included in level 2.
tLevel 3: If one ore more of the significant inputs used in applying the valuation technique is not based on observable market date, the
financial instrument is included in level 3.
(in millions of EUR) Note Level 1 Level 2 Level 3 Total
Non-Current
Available for sale - through equity 11 124 2 - 126
Derivatives - through profit or loss 19 - 96 - 96
Derivatives - through equity 19 - - - -
Current
Available for sale - through equity 11 12 - - 12
Derivatives - through profit or loss 19 - - - -
Derivatives - through equity 19 - - - -
Total financial assets measured at fair value 136 98 - 234
During 2009, no transfers between the different fair value hierarchy levels took place.
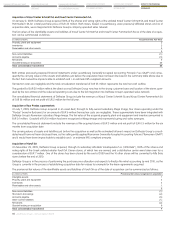
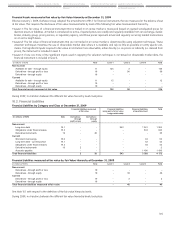
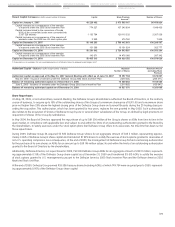
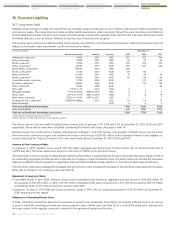
10.2. Financial Liabilities
Financial Liabilities by Category and Class at December 31, 2009
Financial liabilities measured Financial liabilities Financial liabilities Total
at fair value being part of a fair value at amortized cost
hedge relationship
(in millions of EUR) Note Derivatives - Derivatives -
through through
profit or loss equity
Non-current
Long-term debt 18.1 - - 543 1 361 1 904
Obligations under finance leases 18.3 - - - 643 643
Derivative instruments 19 - 38 - - 38
Current
Short-term borrowings 18.2 - - - 63 63
Long-term debt - current portion 18.1 - - - 42 42
Obligations under finance leases 18.3 - - - 44 44
Derivative instruments 19 2 - - - 2
Accounts payable - - - 1 436 1 436
Total financial liabilities 2 38 543 3 589 4 172
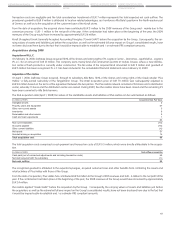
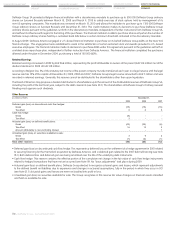
Financial Liabilities measured at fair value by Fair Value Hierarchy at December 31, 2009
(in millions of EUR) Note Level 1 Level 2 Level 3 Total
Non-current
Derivatives - through profit or loss 19 - - - -
Derivatives - through equity 19 - 38 - 38
Current
Derivatives - through profit or loss 19 - 2 - 2
Derivatives - through equity 19 - - - -
Total financial liabilities measured at fair value - 40 - 40
See Note 10.1 with respect to the definition of the fair value hierarchy levels.
During 2009, no transfers between the different fair value hierarchy levels took place.