Food Lion 2009 Annual Report Download - page 108
Download and view the complete annual report
Please find page 108 of the 2009 Food Lion annual report below. You can navigate through the pages in the report by either clicking on the pages listed below, or by using the keyword search tool below to find specific information within the annual report.-
 1
1 -
2
-
3
-
4
-
5
-
6
-
7
-
8
-
9
-
10
-
11
-
12
-
13
-
14
-
15
-
16
-
17
-
18
-
19
-
20
-
21
-
22
-
23
-
24
-
25
-
26
-
27
-
28
-
29
-
30
-
31
-
32
-
33
-
34
-
35
-
36
-
37
-
38
-
39
-
40
-
41
-
42
-
43
-
44
-
45
-
46
-
47
-
48
-
49
-
50
-
51
-
52
-
53
-
54
-
55
-
56
-
57
-
58
-
59
-
60
-
61
-
62
-
63
-
64
-
65
-
66
-
67
-
68
-
69
-
70
-
71
-
72
-
73
-
74
-
75
-
76
-
77
-
78
-
79
-
80
-
81
-
82
-
83
-
84
-
85
-
86
-
87
-
88
-
89
-
90
-
91
-
92
-
93
-
94
-
95
-
96
-
97
-
 98
98 -
 99
99 -
 100
100 -
 101
101 -
 102
102 -
 103
103 -
 104
104 -
 105
105 -
 106
106 -
 107
107 -
 108
108 -
 109
109 -
 110
110 -
 111
111 -
 112
112 -
 113
113 -
 114
114 -
 115
115 -
 116
116 -
 117
117 -
 118
118 -
119
-
120
-
121
-
122
-
123
-
124
-
125
-
126
-
127
-
128
-
129
-
130
-
131
-
132
-
133
-
134
-
135
-
136
-
137
-
138
-
139
-
140
-
141
-
142
-
143
-
144
-
145
-
146
-
147
-
148
-
149
-
150
-
151
-
152
-
153
-
154
-
155
-
156
-
157
-
158
-
159
-
160
-
161
-
162
-
163
 |
 |

104 - Delhaize Group - Annual Report 2009
CONSOLIDATED STATEMENT
OF CHANGES IN EQUITY
CONSOLIDATED STATEMENT
OF CASH FLOWS
NOTES TO THE FINANCIAL
STATEMENTS
CONSOLIDATED STATEMENT
OF COMPREHENSIVE INCOME
CONSOLIDATED INCOME
STATEMENT
CONSOLIDATED BALANCE SHEET
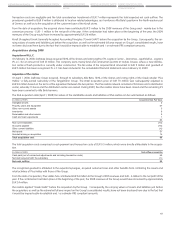
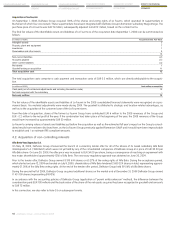
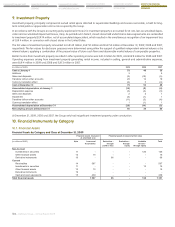
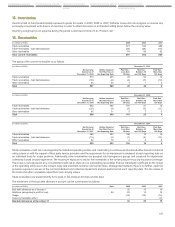
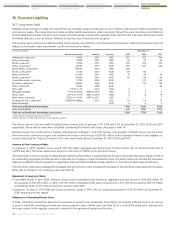
9. Investment Property
Investment property, principally comprised of owned rental space attached to supermarket buildings and excess real estate, is held for long-
term rental yields or appreciation and is not occupied by the Group.
In accordance with the Group’s accounting policy explained in Note 2.3, investment property is accounted for at cost, less accumulated depre-
cation and accumulated impairment losses, if any. As pointed out in Note 8, closed stores held under finance lease agreements are reclassified
to investment property (EUR 14 million, net of accumulated depreciation), which resulted in the simultaneous recognition of an impairment loss
of EUR 4 million, in connection with closed stores in the United States.
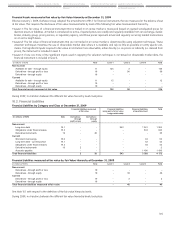
The fair value of investment property amounted to EUR 69 million, EUR 52 million and EUR 50 million at December 31, 2009, 2008 and 2007,
respectively. The fair values for disclosure purposes were determined using either the support of qualified independent external valuers or by
internal valuers, applying a combination of the present value of future cash flows and observable market values of comparable properties.
Rental income from investment property recorded in other operating income was EUR 4 million for 2009, and EUR 3 million for 2008 and 2007.
Operating expenses arising from investment property generating rental income, included in selling, general and administrative expenses,
were EUR 4 million in 2009 and 2008 and EUR 3 million in 2007.
(in millions of EUR) 2009 2008 2007
Cost at January 1 53 48 30
Additions 3 - 8
Sales and disposals (3) (10) (5)
Transfers to/from other accounts 28 12 19
Currency translation effect (2) 3 (4)
Cost at December 31 79 53 48
Accumulated depreciation at January 1 (14) (8) (4)
Depreciation expense (3) (3) (3)
Sales and disposals 2 2 1
Impairment (4) (1) 1
Transfers to/from other accounts (11) (3) (4)
Currency translation effect 1 (1) 1
Accumulated depreciation at December 31 (29) (14) (8)
Net carrying amount at December 31 50 39 40
At December 31, 2009, 2008 and 2007, the Group only had insignificant investment property under construction.
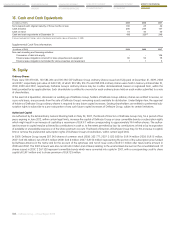
10. Financial Instruments by Category
10.1. Financial Assets
Financial Assets by Category and Class at December 31, 2009
Financial assets measured Financial assets measured at fair value
at amortized cost
(in millions of EUR) Note Loans and Derivatives - Derivatives - Available Total
Receivables through through for sale -
profit or loss equity through equity
Non-Current
Investments in securities 11 - - - 126 126
Other financial assets 12 16 - - - 16
Derivative instruments 19 - 96 - - 96
Current
Receivables 14 597 - - - 597
Investments in securities 11 - - - 12 12
Other financial assets 12 15 - - - 15
Derivative instruments 19 - - - - -
Cash and cash equivalents 15 439 - - - 439
Total financial assets 1 067 96 - 138 1 301