Food Lion 2009 Annual Report Download - page 111
Download and view the complete annual report
Please find page 111 of the 2009 Food Lion annual report below. You can navigate through the pages in the report by either clicking on the pages listed below, or by using the keyword search tool below to find specific information within the annual report.-
 1
1 -
2
-
3
-
4
-
5
-
6
-
7
-
8
-
9
-
10
-
11
-
12
-
13
-
14
-
15
-
16
-
17
-
18
-
19
-
20
-
21
-
22
-
23
-
24
-
25
-
26
-
27
-
28
-
29
-
30
-
31
-
32
-
33
-
34
-
35
-
36
-
37
-
38
-
39
-
40
-
41
-
42
-
43
-
44
-
45
-
46
-
47
-
48
-
49
-
50
-
51
-
52
-
53
-
54
-
55
-
56
-
57
-
58
-
59
-
60
-
61
-
62
-
63
-
64
-
65
-
66
-
67
-
68
-
69
-
70
-
71
-
72
-
73
-
74
-
75
-
76
-
77
-
78
-
79
-
80
-
81
-
82
-
83
-
84
-
85
-
86
-
87
-
88
-
89
-
90
-
91
-
92
-
93
-
94
-
95
-
96
-
97
-
98
-
99
-
100
-
 101
101 -
 102
102 -
 103
103 -
 104
104 -
 105
105 -
 106
106 -
 107
107 -
 108
108 -
 109
109 -
 110
110 -
 111
111 -
 112
112 -
 113
113 -
 114
114 -
 115
115 -
 116
116 -
 117
117 -
 118
118 -
 119
119 -
 120
120 -
 121
121 -
122
-
123
-
124
-
125
-
126
-
127
-
128
-
129
-
130
-
131
-
132
-
133
-
134
-
135
-
136
-
137
-
138
-
139
-
140
-
141
-
142
-
143
-
144
-
145
-
146
-
147
-
148
-
149
-
150
-
151
-
152
-
153
-
154
-
155
-
156
-
157
-
158
-
159
-
160
-
161
-
162
-
163
 |
 |
107
SUMMARY STATUTORY ACCOUNTS
OF DELHAIZE GROUP SA
HISTORICAL FINANCIAL OVERVIEW CERTIFICATION OF RESPONSIBLE
PERSONS
REPORT OF THE STATUTORY AUDITOR
SUPPLEMENTARY INFORMATION
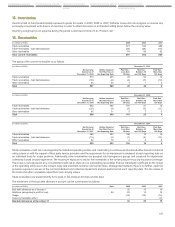
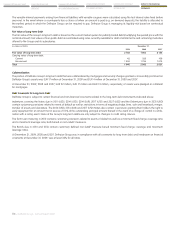
13. Inventories
Inventory held at hand predominately represents goods for resale. In 2009, 2008 or 2007, Delhaize Group did not recognize (or reverse any
previously recognized) write-downs of inventory in order to reflect decreases in anticipated selling prices below the carrying value.
Inventory recognised as an expense during the period is disclosed in Note 25 as “Product cost.”
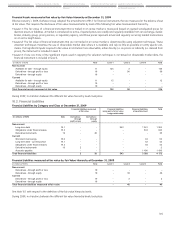
14. Receivables
(in millions of EUR) 2009 2008 2007
Trade receivables 573 542 488
Trade receivables - bad debt allowance (30) (20) (15)
Other receivables 54 86 92
Total current receivables 597 608 565
The aging of the current receivables is as follows:
(in millions of EUR) December 31, 2009
Net Carrying Neither Impaired Past Due - Past Due - Past Due -
Amount as of Nor Past Due on Less than Between 30 More than
December 31, 2009 the Reporting Date 30 Days and 180 Days 180 Days
Trade receivables 573 455 45 54 19
Trade receivables - bad debt allowance (30) (2) (2) (7) (19)
Other receivables 54 46 3 1 4
Total 597 499 46 48 4
(in millions of EUR) December 31, 2008
Net Carrying Neither Impaired Past Due - Past Due - Past Due -
Amount as of Nor Past Due on Less than Between 30 More than
December 31, 2008 the Reporting Date 30 Days and 180 Days 180 Days
Trade receivables 542 402 107 21 12
Trade receivables - bad debt allowance (20) (4) (2) (3) (11)
Other receivables 86 71 5 7 3
Total 608 469 110 25 4
(in millions of EUR) December 31, 2007
Net Carrying Neither Impaired Past Due - Past Due - Past Due -
Amount as of Nor Past Due on Less than Between 30 More than
December 31, 2007 the Reporting Date 30 Days and 180 Days 180 Days
Trade receivables 488 357 106 15 10
Trade receivables - bad debt allowance (15) (2) (1) (2) (10)
Other receivables 92 78 4 6 4
Total 565 433 109 19 4
Trade receivables credit risk is managed by the individual operating entities and credit rating is continuously monitored either based on internal
rating criteria or with the support of third party service providers and the requirement for an impairment is analysed at each reporting date on
an individual basis for major positions. Additionally, minor receivables are grouped into homogenous groups and assessed for impairment
collectively, based on past experience. The maximum exposure to risk for the receivables is the carrying value minus any insurance coverage.
The Group is not exposed to any concentrated credit risk as there are no outstanding receivables that are individually significant for the Group
or the operating entity, due to the Group’s large and unrelated customer and vendor base. Management believes there is no further credit risk
provision required in excess of the normal individual and collective impairment analysis performed at each reporting date. The fair values of
the trade and other receivables equal their (net) carrying values.
Trade receivables are predominantly to be paid, in full, between 30 days and 60 days.
The movement of the bad debt allowance account can be summarized as follows:
(in millions of EUR) Note 2009 2008 2007
Bad debt allowance as of January 1 20 15 19
Additions (recognized in profit or loss) 24 20 15 12
Usage (10) (10) (14)
Currency translation effect - - (2)
Bad debt allowance at December 31 30 20 15