Food Lion 2009 Annual Report Download - page 129
Download and view the complete annual report
Please find page 129 of the 2009 Food Lion annual report below. You can navigate through the pages in the report by either clicking on the pages listed below, or by using the keyword search tool below to find specific information within the annual report.-
 1
1 -
2
-
3
-
4
-
5
-
6
-
7
-
8
-
9
-
10
-
11
-
12
-
13
-
14
-
15
-
16
-
17
-
18
-
19
-
20
-
21
-
22
-
23
-
24
-
25
-
26
-
27
-
28
-
29
-
30
-
31
-
32
-
33
-
34
-
35
-
36
-
37
-
38
-
39
-
40
-
41
-
42
-
43
-
44
-
45
-
46
-
47
-
48
-
49
-
50
-
51
-
52
-
53
-
54
-
55
-
56
-
57
-
58
-
59
-
60
-
61
-
62
-
63
-
64
-
65
-
66
-
67
-
68
-
69
-
70
-
71
-
72
-
73
-
74
-
75
-
76
-
77
-
78
-
79
-
80
-
81
-
82
-
83
-
84
-
85
-
86
-
87
-
88
-
89
-
90
-
91
-
92
-
93
-
94
-
95
-
96
-
97
-
98
-
99
-
100
-
101
-
102
-
103
-
104
-
105
-
106
-
107
-
108
-
109
-
110
-
111
-
112
-
113
-
114
-
115
-
116
-
117
-
118
-
 119
119 -
 120
120 -
 121
121 -
 122
122 -
 123
123 -
 124
124 -
 125
125 -
 126
126 -
 127
127 -
 128
128 -
 129
129 -
 130
130 -
 131
131 -
 132
132 -
 133
133 -
 134
134 -
 135
135 -
 136
136 -
 137
137 -
 138
138 -
 139
139 -
140
-
141
-
142
-
143
-
144
-
145
-
146
-
147
-
148
-
149
-
150
-
151
-
152
-
153
-
154
-
155
-
156
-
157
-
158
-
159
-
160
-
161
-
162
-
163
 |
 |

125
SUMMARY STATUTORY ACCOUNTS
OF DELHAIZE GROUP SA
HISTORICAL FINANCIAL OVERVIEW CERTIFICATION OF RESPONSIBLE
PERSONS
REPORT OF THE STATUTORY AUDITOR
SUPPLEMENTARY INFORMATION
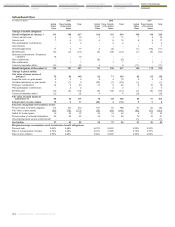
(in millions of EUR) 2009 2008 2007
United Plans Outside Total United Plans Outside Total United Plans Outside Total
States of the United States of the United States of the United
Plans States Plans States Plans States
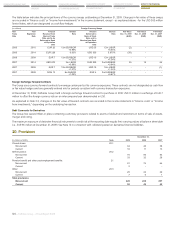
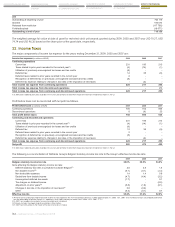
Components of pension cost:
Amounts recognized in the income
statement:
Current service cost 8 4 12 7 4 11 7 5 12
Interest cost 7 6 13 6 6 12 6 5 11
Expected return on plan assets (6) (3) (9) (6) (4) (10) (6) (3) (9)
Amortization of past service cost - - - 1 - 1 - - -
Curtailment gain recognized - - - (8) - (8) - - -
Settlement loss recognized - 1 1 - 1 1 - 1 1
Total pension cost recognized in the
income statement 9 8 17 - 7 7 7 8 15
Amounts recognized in OCI:
Actuarial (gains)/losses immediately
recognized 2 7 9 30 (1) 29 - (10) (10)
Effect of changes in exchange rates 1 - 1 - - - - - -
Cumulative amount of actuarial gains
and losses recognized 31 12 43 28 5 33 (2) 6 4
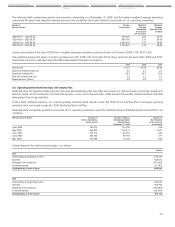
Weighted average assumptions
used to determine pension cost:
Discount rate 6.01% 5.55% 6.00% 5.32% 5.75% 4.34%
Expected long-term rate of return on plan
assets during year 7.75% 4.40% 7.75% 4.90% 7.75% 4.15%
Rate of compensation increase 4.67% 3.38% 4.76% 3.37% 4.60% 3.36%
Rate of price inflation 3.50% 2.09% 3.50% 2.08% 3.50% 2.07%
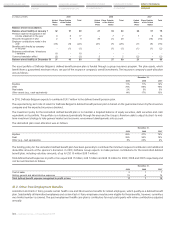
(in millions of EUR) 2009 2008 2007
United Plans Outside Total United Plans Outside Total United Plans Outside Total
States of the United States of the United States of the United
Plans States Plans States Plans States
Historical Information
Defined benefit obligation 136 121 257 111 106 217 104 110 214
Plan Assets 99 78 177 79 69 148 82 71 153
Surplus 37 43 80 32 37 69 21 39 60
Experience (gains) and losses:
Related to plan assets (9) 1 (8) 28 1 29 1 - 1
Percentage of plan assets -9.15% 0.93% -4.52% 35.61% 0.87% 19.38% 0.30% -0.14% 0.13%
Related to plan liabilities - 1 1 2 1 3 1 - 1
Percentage of plan liabilities -0.04% 0.49% 0.39% 1.83% 1.13% 1.51% 0.63% 0.09% 0.37%
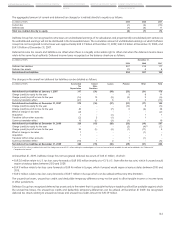
(in millions of EUR) 2006 2005
United Plans Outside Total United Plans Outside Total
States of the United States of the United
Plans States Plans States
Historical Information
Defined benefit obligation 109 116 225 121 114 235
Plan Assets 85 65 150 82 60 142
Surplus 24 51 75 39 54 93
Experience (gains) and losses:
Related to plan assets (4) 1 (3) 1 1 2
Percentage of plan assets -5.10% 0.44% -2.73% 0.68% 1.01% 0.85%
Related to plan liabilities (3) 1 (2) 1 12 13
Percentage of plan liabilities -2.48% 0.84% -0.76% 0.45% 10.22% 5.18%