Food Lion 2009 Annual Report Download - page 150
Download and view the complete annual report
Please find page 150 of the 2009 Food Lion annual report below. You can navigate through the pages in the report by either clicking on the pages listed below, or by using the keyword search tool below to find specific information within the annual report.-
 1
1 -
2
-
3
-
4
-
5
-
6
-
7
-
8
-
9
-
10
-
11
-
12
-
13
-
14
-
15
-
16
-
17
-
18
-
19
-
20
-
21
-
22
-
23
-
24
-
25
-
26
-
27
-
28
-
29
-
30
-
31
-
32
-
33
-
34
-
35
-
36
-
37
-
38
-
39
-
40
-
41
-
42
-
43
-
44
-
45
-
46
-
47
-
48
-
49
-
50
-
51
-
52
-
53
-
54
-
55
-
56
-
57
-
58
-
59
-
60
-
61
-
62
-
63
-
64
-
65
-
66
-
67
-
68
-
69
-
70
-
71
-
72
-
73
-
74
-
75
-
76
-
77
-
78
-
79
-
80
-
81
-
82
-
83
-
84
-
85
-
86
-
87
-
88
-
89
-
90
-
91
-
92
-
93
-
94
-
95
-
96
-
97
-
98
-
99
-
100
-
101
-
102
-
103
-
104
-
105
-
106
-
107
-
108
-
109
-
110
-
111
-
112
-
113
-
114
-
115
-
116
-
117
-
118
-
119
-
120
-
121
-
122
-
123
-
124
-
125
-
126
-
127
-
128
-
129
-
130
-
131
-
132
-
133
-
134
-
135
-
136
-
137
-
138
-
139
-
 140
140 -
 141
141 -
 142
142 -
 143
143 -
 144
144 -
 145
145 -
 146
146 -
 147
147 -
 148
148 -
 149
149 -
 150
150 -
 151
151 -
 152
152 -
 153
153 -
 154
154 -
 155
155 -
 156
156 -
 157
157 -
 158
158 -
 159
159 -
 160
160 -
161
-
162
-
163
 |
 |
146 - Delhaize Group - Annual Report 2009
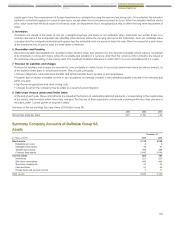
CONSOLIDATED STATEMENT
OF CHANGES IN EQUITY
CONSOLIDATED STATEMENT
OF CASH FLOWS
NOTES TO THE FINANCIAL
STATEMENTS
CONSOLIDATED STATEMENT
OF COMPREHENSIVE INCOME
CONSOLIDATED INCOME
STATEMENT
CONSOLIDATED BALANCE SHEET
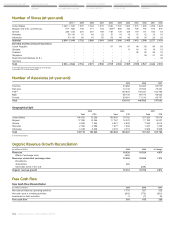
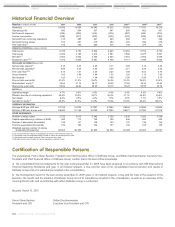
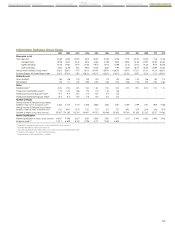
Historical Financial Overview
Results (in millions of EUR) 2009 2008 2007 2006 2005
(4)
2004
(4)
2003
(4)
Revenues 19 938 19 024 18 943 19 215 18 345 17 597 18 215
Operating profit 942 904 937 947 900 862 801
Net financial expenses (202) (202) (332) (276) (297) (305) (319)
Income tax expense (228) (217) (204) (245) (224) (200) (188)
Net profit from continuing operations 512 485 401 426 380 357 294
Net profit (Group share) 514 467 410 352 365 296 279
Free cash flow(1) 518 150 326 215 149 373 441
FINANCIAL POSITION (in millions of EUR)
Total assets 9 748 9 700 8 822 9 295 10 254 8 703 8 766
Total equity 4 409 4 195 3 676 3 561 3 596 2 875 2 801
Net debt(1) 2 063 2 402 2 244 2 635 2 943 2 608 3 028
Enterprise value(1)(3) 7 472 6 849 8 281 8 726 8 171 7 849 6 805
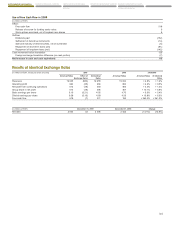
PER SHARE INFORMATION (in EUR)
Net earnings (basic)(2) 5.16 4.70 4.20 3.71 3.89 3.19 3.03
Net earnings (diluted)(2) 5.08 4.59 4.04 3.55 3.71 3.09 3.02
Free cash flow(1)(2) 5.19 1.51 3.35 2.27 1.59 4.03 4.79
Gross dividend 1.60 1.48 1.44 1.32 1.20 1.12 1.00
Net dividend 1.20 1.11 1.08 0.99 0.90 0.84 0.75
Pay-out ratio (net profit) 31.4% 31.9% 35.2% 36.4% 31.4% 35.5% 33.2%
Shareholders’ equity(3) 43.54 41.19 36.17 36.55 37.65 30.34 29.93
Share price (year-end) 53.62 44.20 60.20 63.15 55.20 55.95 40.78
RATIOS (%)
Operating margin 4.7% 4.8% 4.9% 4.9% 4.9% 4.9% 4.4%
Effective tax rate of continuing operations 30.8% 30.9% 33.7% 36.5% 37.1% 35.9% 39.0%
Net margin 2.6% 2.5% 2.2% 1.8% 2.0% 1.7% 1.5%
Net debt to equity(1) 46.8% 57.3% 61.0% 74.0% 81.8% 90.6% 108.1%
CURRENCY INFORMATION
Average EUR per USD rate 0.7169 0.6799 0.7297 0.7964 0.8038 0.8039 0.8840
EUR per USD rate at year-end 0.6942 0.7185 0.6793 0.7593 0.8477 0.7342 0.7918
OTHER INFORMATION
Number of sales outlets 2 732 2 673 2 545 2 705 2 636 2 565 2 559
Capital expenditures (in millions of EUR) 520 714 729 700 636 494 463
Number of associates (thousands) 138 141 138 143 137 138 142
Full-time equivalents (thousands) 104 106 104 107 102 102 105
Weighted average number of shares
outstanding (thousands) 99 803 99 385 97 666 94 939 93 934 92 663 92 097
(1) See “Financial Review” section for explanation of the non GAAP financial measures.
(2) Calculated using the weighted average number of shares outstanding over the year.
(3) Calculated using the total number of shares at the end of the year.
(4) Not adjusted for reclassification of German operations to discontinued.
Certification of Responsible Persons
The undersigned, Pierre-Olivier Beckers, President and Chief Executive Officer of Delhaize Group, and Stéfan Descheemaeker, Executive Vice-
President and Chief Financial Officer of Delhaize Group, confirm that to the best of their knowledge:
a) the consolidated financial statements for the year ending December 31, 2009 have been prepared in accordance with IFRS (International
Financial Reporting Standards) and give, in all material respects, a true and fair view of the consolidated financial position and results of
Delhaize Group and of its subsidiaries included in the consolidation;
b) the management report for the year ending December 31, 2009 gives, in all material respects, a true and fair view of the evolution of the
business, the results and the situation of Delhaize Group and of its subsidiaries included in the consolidation, as well as an overview of the
most significant risks and uncertainties with which Delhaize Group is confronted.
Brussels, March 10, 2010
Pierre-Olivier Beckers Stéfan Descheemaeker
President and CEO Executive Vice-President and CFO