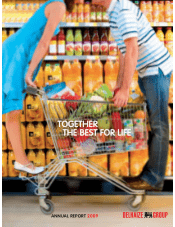
Food Lion 2009 Annual Report Download - page 3
Download and view the complete annual report
Please find page 3 of the 2009 Food Lion annual report below. You can navigate through the pages in the report by either clicking on the pages listed below, or by using the keyword search tool below to find specific information within the annual report.-
 1
1 -
 2
2 -
 3
3 -
 4
4 -
 5
5 -
 6
6 -
 7
7 -
 8
8 -
 9
9 -
 10
10 -
 11
11 -
 12
12 -
 13
13 -
 14
14 -
15
-
16
-
17
-
18
-
19
-
20
-
21
-
22
-
23
-
24
-
25
-
26
-
27
-
28
-
29
-
30
-
31
-
32
-
33
-
34
-
35
-
36
-
37
-
38
-
39
-
40
-
41
-
42
-
43
-
44
-
45
-
46
-
47
-
48
-
49
-
50
-
51
-
52
-
53
-
54
-
55
-
56
-
57
-
58
-
59
-
60
-
61
-
62
-
63
-
64
-
65
-
66
-
67
-
68
-
69
-
70
-
71
-
72
-
73
-
74
-
75
-
76
-
77
-
78
-
79
-
80
-
81
-
82
-
83
-
84
-
85
-
86
-
87
-
88
-
89
-
90
-
91
-
92
-
93
-
94
-
95
-
96
-
97
-
98
-
99
-
100
-
101
-
102
-
103
-
104
-
105
-
106
-
107
-
108
-
109
-
110
-
111
-
112
-
113
-
114
-
115
-
116
-
117
-
118
-
119
-
120
-
121
-
122
-
123
-
124
-
125
-
126
-
127
-
128
-
129
-
130
-
131
-
132
-
133
-
134
-
135
-
136
-
137
-
138
-
139
-
140
-
141
-
142
-
143
-
144
-
145
-
146
-
147
-
148
-
149
-
150
-
151
-
152
-
153
-
154
-
155
-
156
-
157
-
158
-
159
-
160
-
161
-
162
-
163
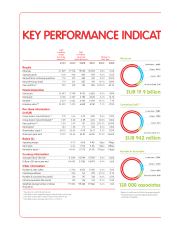
 |
 |

(USD
in millions
except
per share
amounts)
(4)
(EUR
in millions
except per
share amounts)
Change vs
Prior Year
2009 2009 2008 2007 2009 2008
Results
Revenues
27 809 19 938 19 024 18 943 4.8% 0.4%
Operating profit
1 314 942 904 937 4.2% -3.5%
Net profit from continuing operations
714 512 485 401 5.5% 21.2%
Net profit (Group share)
717 514 467 410 10.1% 13.9%
Free cash flow (1)
722 518 150 326 245.2% -54.1%
Financial position
Total assets
13 597 9 748 9 700 8 822 0.5% 9.9%
Total equity
6 150 4 409 4 195 3 676 5.1% 14.1%
Net debt (1)
2 877 2 063 2 402 2 244 -14.1% 7.1%
Enterprise value (1)(3)
10 422 7 472 6 849 8 281 9.1% -17.3%
Per share information
(in EUR)
Group share in net profit (basic) (2)
7.19 5.16 4.70 4.20 9.6% 11.9%
Group share in net profit (diluted) (2)
7.09 5.08 4.59 4.04 10.8% 13.6%
Free cash flow (1)(2)
7.24 5.19 1.51 3.35 243.7% -54.9%
Net dividend
1.67 1.20 1.11 1.08 5.4% 2.8%
Shareholders’ equity (3)
60.73 43.54 41.19 36.17 5.7% 13.9%
Share price (year-end)
74.79 53.62 44.20 60.20 21.3% -26.6%
Ratios (%)
Operating margin
4.7% 4.8% 4.9% -3bps -19bps
Net margin
2.6% 2.5% 2.2% 12bps 29bps
Net debt to equity (1)
46.8% 57.3% 61.0% -105ppt -3.8ppt
Currency information
Average EUR per USD rate
0.7169 0.6799 0.7297 5.4% -6.8%
EUR per USD rate at year-end
0.6942 0.7185 0.6793 -3.4% 5.8%
Other information
Number of sales outlets
2 732 2 673 2 545 2.2% 5.0%
Capital expenditures
520 714 729 -27.1% -2.1%
Number of associates (thousands)
138 141 138 -2.0% 2.3%
Full-time equivalents (thousands)
104 106 104 -2.3% 2.4%
Weighted average number of shares
(thousands)
99 803 99 385 97 666 0.4% 1.8%
(1)
These are non-GAAP financial measures.
(2)
Calculated using the weighted average number of shares over the year.
(3)
Calculated using the total number of shares at the end of the year.
(4)
Calculated using an exchange rate of 1 EUR = 1.3948 USD.
KEY PERFORMANCE INDICA
T
EUR 19.9 billio
n
United States - 68.3
%
United States - 75.0
%
Rest of the World - 1.2
%
(Rest of the World: -0.1
%
Rest of the World - 4.9
%
Greece - 7.4
%
Greece - 6.1
%
Belgium - 23.1
%
Belgium - 19.0
%
Revenues
EUR 942 millio
n
Operating Profit(1)
138 000
associate
s
United States - 75.8
%
Greece - 6.9
%
Belgium - 12.4
%
Number of Associates
(1)
Represents contribution to Delhaize Group operating profit.
Presentation does not include negative operating profit
contribution of Corporate.