Dollar General 2009 Annual Report Download - page 89
Download and view the complete annual report
Please find page 89 of the 2009 Dollar General annual report below. You can navigate through the pages in the report by either clicking on the pages listed below, or by using the keyword search tool below to find specific information within the annual report.-
 1
1 -
2
-
3
-
4
-
5
-
6
-
7
-
8
-
9
-
10
-
11
-
12
-
13
-
14
-
15
-
16
-
17
-
18
-
19
-
20
-
21
-
22
-
23
-
24
-
25
-
26
-
27
-
28
-
29
-
30
-
31
-
32
-
33
-
34
-
35
-
36
-
37
-
38
-
39
-
40
-
41
-
42
-
43
-
44
-
45
-
46
-
47
-
48
-
49
-
50
-
51
-
52
-
53
-
54
-
55
-
56
-
57
-
58
-
59
-
60
-
61
-
62
-
63
-
64
-
65
-
66
-
67
-
68
-
69
-
70
-
71
-
72
-
73
-
74
-
75
-
76
-
77
-
78
-
 79
79 -
 80
80 -
 81
81 -
 82
82 -
 83
83 -
 84
84 -
 85
85 -
 86
86 -
 87
87 -
 88
88 -
 89
89 -
 90
90 -
 91
91 -
 92
92 -
 93
93 -
 94
94 -
 95
95 -
 96
96 -
 97
97 -
 98
98 -
 99
99 -
100
-
101
-
102
-
103
-
104
-
105
-
106
-
107
-
108
-
109
-
110
-
111
-
112
-
113
-
114
-
115
-
116
-
117
-
118
-
119
-
120
-
121
-
122
-
123
-
124
-
125
-
126
-
127
-
128
-
129
-
130
-
131
 |
 |

DOLLAR GENERAL CORPORATION AND SUBSIDIARIES
NOTES TO CONSOLIDATED FINANCIAL STATEMENTS (Continued)
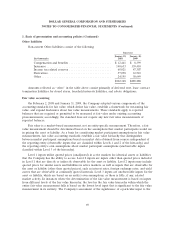
3. Merger (Continued)
adjustments, including the depreciation and amortization of the assets acquired based on their
estimated fair values and changes in interest expense resulting from changes in consolidated debt:
Year Ended
February 1,
(In thousands) 2008
Revenue ............................................... $9,495,246
Net loss ............................................... (57,939)
The pro forma information does not purport to be indicative of what the Company’s results of
operations would have been if the acquisition had in fact occurred at the beginning of the period
presented, and is not intended to be a projection of the Company’s future results of operations.
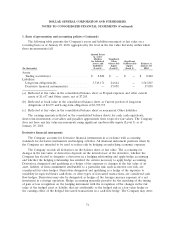
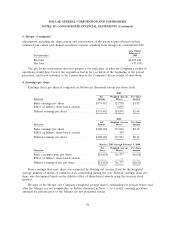
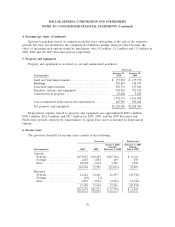
4. Earnings per share
Earnings (loss) per share is computed as follows (in thousands except per share data):
2009
Net Weighted Average Per Share
Successor Income Shares Amount
Basic earnings per share ................ $339,442 322,778 $1.05
Effect of dilutive share-based awards ....... 2,058
Diluted earnings per share ............... $339,442 324,836 $1.04
2008
Net Weighted Average Per Share
Successor Income Shares Amount
Basic earnings per share ................ $108,182 317,024 $0.34
Effect of dilutive share-based awards ....... 479
Diluted earnings per share ............... $108,182 317,503 $0.34
March 6, 2007 through February 1, 2008
Net Weighted Average Per Share
Successor Loss Shares Amount
Basic earnings (loss) per share ............. $(4,818) 316,777 $(0.02)
Effect of dilutive share-based awards ........ —
Diluted earnings (loss) per share ........... $(4,818) 316,777 $(0.02)
Basic earnings (loss) per share was computed by dividing net income (loss) by the weighted
average number of shares of common stock outstanding during the year. Diluted earnings (loss) per
share was determined based on the dilutive effect of share-based awards using the treasury stock
method.
Because of the Merger, the Company’s weighted average shares outstanding for periods before and
after the Merger are not comparable, as further discussed in Note 1. As a result, earnings per share
amounts for periods prior to the Merger are not presented herein.
78