Dollar General 2009 Annual Report Download - page 116
Download and view the complete annual report
Please find page 116 of the 2009 Dollar General annual report below. You can navigate through the pages in the report by either clicking on the pages listed below, or by using the keyword search tool below to find specific information within the annual report.-
 1
1 -
2
-
3
-
4
-
5
-
6
-
7
-
8
-
9
-
10
-
11
-
12
-
13
-
14
-
15
-
16
-
17
-
18
-
19
-
20
-
21
-
22
-
23
-
24
-
25
-
26
-
27
-
28
-
29
-
30
-
31
-
32
-
33
-
34
-
35
-
36
-
37
-
38
-
39
-
40
-
41
-
42
-
43
-
44
-
45
-
46
-
47
-
48
-
49
-
50
-
51
-
52
-
53
-
54
-
55
-
56
-
57
-
58
-
59
-
60
-
61
-
62
-
63
-
64
-
65
-
66
-
67
-
68
-
69
-
70
-
71
-
72
-
73
-
74
-
75
-
76
-
77
-
78
-
79
-
80
-
81
-
82
-
83
-
84
-
85
-
86
-
87
-
88
-
89
-
90
-
91
-
92
-
93
-
94
-
95
-
96
-
97
-
98
-
99
-
100
-
101
-
102
-
103
-
104
-
105
-
 106
106 -
 107
107 -
 108
108 -
 109
109 -
 110
110 -
 111
111 -
 112
112 -
 113
113 -
 114
114 -
 115
115 -
 116
116 -
 117
117 -
 118
118 -
 119
119 -
 120
120 -
 121
121 -
 122
122 -
 123
123 -
 124
124 -
 125
125 -
 126
126 -
127
-
128
-
129
-
130
-
131
 |
 |

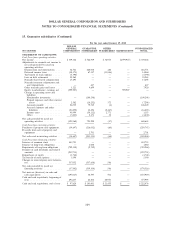
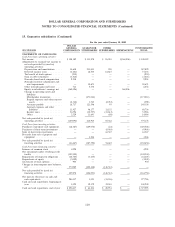
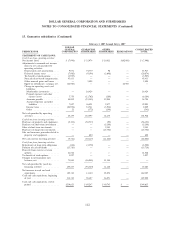
DOLLAR GENERAL CORPORATION AND SUBSIDIARIES
NOTES TO CONSOLIDATED FINANCIAL STATEMENTS (Continued)
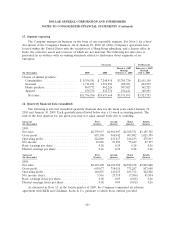
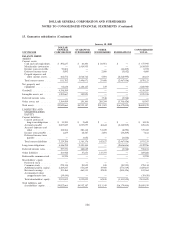
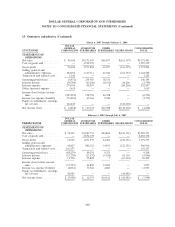
15. Guarantor subsidiaries (Continued)
The following consolidating schedules present condensed financial information on a combined basis, in
thousands.
January 29, 2010
DOLLAR
GENERAL GUARANTOR OTHER CONSOLIDATED
SUCCESSOR CORPORATION SUBSIDIARIES SUBSIDIARIES ELIMINATIONS TOTAL
BALANCE SHEET:
ASSETS
Current assets:
Cash and cash equivalents $ 97,620 $ 103,001 $ 21,455 $ — $ 222,076
Merchandise inventories . — 1,519,578 — — 1,519,578
Income taxes receivable . 9,924 1,645 — (4,026) 7,543
Deferred income taxes . . 16,066 — 3,559 (19,625) —
Prepaid expenses and
other current assets . . . 625,157 3,040,792 704 (3,570,401) 96,252
Total current assets .... 748,767 4,665,016 25,718 (3,594,052) 1,845,449
Net property and
equipment .......... 99,452 1,228,829 105 — 1,328,386
Goodwill ............ 4,338,589 — — — 4,338,589
Intangible assets, net ..... 1,201,223 83,060 — — 1,284,283
Deferred income taxes .... — — 36,405 (36,405) —
Other assets, net ....... 4,288,270 8,920 297,757 (4,528,135) 66,812
Total assets ........... $10,676,301 $5,985,825 $359,985 $(8,158,592) $8,863,519
LIABILITIES AND
SHAREHOLDERS’
EQUITY
Current liabilities:
Current portion of
long-term obligations . . $ 1,822 $ 1,849 $ — $ — $ 3,671
Accounts payable ..... 3,033,723 1,311,063 46,818 (3,560,651) 830,953
Accrued expenses and
other ............ 72,320 226,571 53,149 (9,750) 342,290
Income taxes payable . . . 4,086 — 4,465 (4,026) 4,525
Deferred income taxes
payable .......... — 44,686 — (19,625) 25,061
Total current liabilities . . 3,111,951 1,584,169 104,432 (3,594,052) 1,206,500
Long-term obligations .... 3,645,820 2,689,492 13,178 (2,948,775) 3,399,715
Deferred income taxes .... 394,045 188,532 — (36,405) 546,172
Other liabilities ........ 115,701 40,065 146,582 — 302,348
Redeemable common stock 18,486 — — — 18,486
Shareholders’ equity:
Preferred stock ....... — — — — —
Common stock ....... 298,013 23,855 100 (23,955) 298,013
Additional paid-in capital 2,923,377 431,253 19,900 (451,153) 2,923,377
Retained earnings ..... 203,075 1,028,459 75,793 (1,104,252) 203,075
Accumulated other
comprehensive loss . . . (34,167) — — — (34,167)
Total shareholders’ equity 3,390,298 1,483,567 95,793 (1,579,360) 3,390,298
Total liabilities and
shareholders’ equity .... $10,676,301 $5,985,825 $359,985 $(8,158,592) $8,863,519
105