Dollar General 2009 Annual Report Download - page 109
Download and view the complete annual report
Please find page 109 of the 2009 Dollar General annual report below. You can navigate through the pages in the report by either clicking on the pages listed below, or by using the keyword search tool below to find specific information within the annual report.-
 1
1 -
2
-
3
-
4
-
5
-
6
-
7
-
8
-
9
-
10
-
11
-
12
-
13
-
14
-
15
-
16
-
17
-
18
-
19
-
20
-
21
-
22
-
23
-
24
-
25
-
26
-
27
-
28
-
29
-
30
-
31
-
32
-
33
-
34
-
35
-
36
-
37
-
38
-
39
-
40
-
41
-
42
-
43
-
44
-
45
-
46
-
47
-
48
-
49
-
50
-
51
-
52
-
53
-
54
-
55
-
56
-
57
-
58
-
59
-
60
-
61
-
62
-
63
-
64
-
65
-
66
-
67
-
68
-
69
-
70
-
71
-
72
-
73
-
74
-
75
-
76
-
77
-
78
-
79
-
80
-
81
-
82
-
83
-
84
-
85
-
86
-
87
-
88
-
89
-
90
-
91
-
92
-
93
-
94
-
95
-
96
-
97
-
98
-
 99
99 -
 100
100 -
 101
101 -
 102
102 -
 103
103 -
 104
104 -
 105
105 -
 106
106 -
 107
107 -
 108
108 -
 109
109 -
 110
110 -
 111
111 -
 112
112 -
 113
113 -
 114
114 -
 115
115 -
 116
116 -
 117
117 -
 118
118 -
 119
119 -
120
-
121
-
122
-
123
-
124
-
125
-
126
-
127
-
128
-
129
-
130
-
131
 |
 |

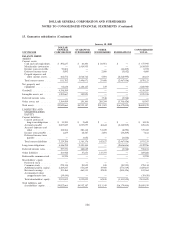
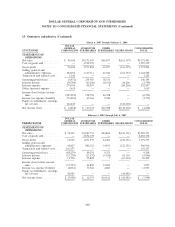
DOLLAR GENERAL CORPORATION AND SUBSIDIARIES
NOTES TO CONSOLIDATED FINANCIAL STATEMENTS (Continued)
11. Share-based payments (Continued)
For the year ended January 29, 2010, the fair value method of accounting for share-based awards
resulted in share-based compensation expense (a component of SG&A expenses) and a corresponding
reduction in net income before income taxes in the amount of $22.2 million ($13.6 million net of tax)
of which $11.7 million ($7.1 million net of tax) was related to stock options, $7.2 million ($4.4 million
net of tax) was related to equity appreciation rights and $3.3 million ($2.0 million net of tax) was
related to restricted stock as discussed in more detail below. Of these amounts, $6.9 million of the
expense for equity appreciation rights and $2.5 million of the expense for restricted stock was
attributable to the vesting of certain awards in conjunction with the Company’s initial public offering
discussed in Note 2.
For the year ended January 30, 2009, the Company recorded share-based compensation expense
and a corresponding reduction in net income before income taxes in the amount of $10.0 million
($6.1 million net of tax) of which $8.9 million ($5.4 million net of tax) was related to stock options and
$1.1 million ($0.7 million net of tax) was related to restricted stock.
The 2007 Successor statement of operations reflects share-based compensation expense and a
corresponding reduction of pre-tax income in the amount of $3.8 million ($2.4 million net of tax). The
Company recognized $45.4 million of share-based compensation expense in the 2007 Predecessor
statement of operations ($28.5 million net of tax), including $6.0 million of compensation expense prior
to the Merger included in SG&A expenses comprised of $2.3 million for stock options and $3.7 million
for restricted stock and restricted stock units. The remaining $39.4 million of such expense related
directly to the Merger is reflected in Transaction and related costs in the consolidated statement of
operations for the Predecessor period ended July 6, 2007, for the accelerated vesting of stock options
($18.7 million) and restricted stock and restricted stock units ($20.7 million).
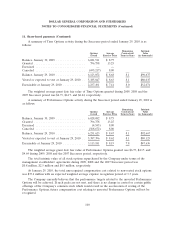
The fair value of each option grant is separately estimated by applying the Black-Scholes-Merton
option pricing valuation model. The weighted average for key assumptions used in determining the fair
value of options granted in the years ended January 29, 2010 and January 30, 2009, the Successor
period ended February 1, 2008, and the Predecessor period ended July 6, 2007, and a summary of the
methodology applied to develop each assumption, are as follows:
Successor Predecessor
January 29, January 30, February 1, July 6,
2010 2009 2008 2007
Expected dividend yield ....................... 0% 0% 0% 0.91%
Expected stock price volatility ................... 41.2% 40.2% 41.9% 18.5%
Weighted average risk-free interest rate ............ 2.8% 2.8% 4.6% 4.5%
Expected term of options (years) ................ 7.4 7.4 7.5 5.7
Expected dividend yield—This is an estimate of the expected dividend yield on the Company’s
stock. Prior to the Merger this estimate was based on historical dividend payment trends. Subsequent to
the Merger, the Company is subject to limitations on the payment of dividends under its Credit
Facilities as further discussed in Note 7. An increase in the dividend yield will decrease compensation
expense.
Expected stock price volatility—This is a measure of the amount by which the price of the
Company’s common stock has fluctuated or is expected to fluctuate. Prior to the Merger, the Company
used actual historical changes in the market price of the Company’s common stock and implied
98