Dollar General 2009 Annual Report Download - page 20
Download and view the complete annual report
Please find page 20 of the 2009 Dollar General annual report below. You can navigate through the pages in the report by either clicking on the pages listed below, or by using the keyword search tool below to find specific information within the annual report.-
 1
1 -
2
-
3
-
4
-
5
-
6
-
7
-
8
-
9
-
 10
10 -
 11
11 -
 12
12 -
 13
13 -
 14
14 -
 15
15 -
 16
16 -
 17
17 -
 18
18 -
 19
19 -
 20
20 -
 21
21 -
 22
22 -
 23
23 -
 24
24 -
 25
25 -
 26
26 -
 27
27 -
 28
28 -
 29
29 -
 30
30 -
31
-
32
-
33
-
34
-
35
-
36
-
37
-
38
-
39
-
40
-
41
-
42
-
43
-
44
-
45
-
46
-
47
-
48
-
49
-
50
-
51
-
52
-
53
-
54
-
55
-
56
-
57
-
58
-
59
-
60
-
61
-
62
-
63
-
64
-
65
-
66
-
67
-
68
-
69
-
70
-
71
-
72
-
73
-
74
-
75
-
76
-
77
-
78
-
79
-
80
-
81
-
82
-
83
-
84
-
85
-
86
-
87
-
88
-
89
-
90
-
91
-
92
-
93
-
94
-
95
-
96
-
97
-
98
-
99
-
100
-
101
-
102
-
103
-
104
-
105
-
106
-
107
-
108
-
109
-
110
-
111
-
112
-
113
-
114
-
115
-
116
-
117
-
118
-
119
-
120
-
121
-
122
-
123
-
124
-
125
-
126
-
127
-
128
-
129
-
130
-
131
 |
 |

In addition, we have actively sought to improve our inventory turns, and we believe that there
remains opportunity for improvement. Initiatives along this front have included reducing excess
inventory in stores and better inventory tracking. We turned our inventory approximately 5.3 times over
the most recent four quarters
Seasonality
Our business is seasonal to a certain extent. Generally, our highest sales volume occurs in the
fourth quarter, which includes the Christmas selling season, and the lowest occurs in the first quarter.
In addition, our quarterly results can be affected by the timing of new store openings and store
closings, the amount of sales contributed by new and existing stores, as well as the timing of certain
holidays. We purchase substantial amounts of inventory in the third quarter and incur higher shipping
costs and higher payroll costs in anticipation of the increased sales activity during the fourth quarter. In
addition, we carry merchandise during our fourth quarter that we do not carry during the rest of the
year, such as gift sets, holiday decorations, certain baking items, and a broader assortment of toys and
candy.
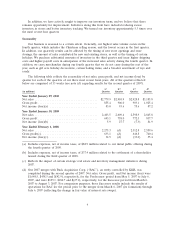
The following table reflects the seasonality of net sales, gross profit, and net income (loss) by
quarter for each of the quarters of our three most recent fiscal years. All of the quarters reflected
below are comprised of 13 weeks (see note (d) regarding results for the second quarter of 2007).
1st 2nd 3rd 4th
(in millions) Quarter Quarter Quarter Quarter
Year Ended January 29, 2010
Net sales ..................................... $2,779.9 $2,901.9 $2,928.8 $3,185.8
Gross profit ................................... 855.4 906.0 903.1 1,025.4
Net income (loss)(a) ............................ 83.0 93.6 75.6 87.2
Year Ended January 30, 2009
Net sales ..................................... 2,403.5 2,609.4 2,598.9 2,845.8
Gross profit ................................... 693.1 758.0 772.3 837.7
Net income (loss)(b) ............................ 5.9 27.7 (7.3) 81.9
Year Ended February 1, 2008
Net sales ..................................... 2,275.3 (d) 2,312.8 2,559.6
Gross profit(c) ................................. 633.1 (d) 646.8 740.4
Net income (loss)(c) ............................. 34.9 (d) (33.0) 55.4
(a) Includes expenses, net of income taxes, of $82.9 million related to our initial public offering during
the fourth quarter of 2009.
(b) Includes expenses, net of income taxes, of $37.4 million related to the settlement of a shareholder
lawsuit during the third quarter of 2008.
(c) Reflects the impact of certain strategic real estate and inventory management initiatives during
2007.
(d) Our 2007 merger with Buck Acquisition Corp. (‘‘BAC’’), an entity controlled by KKR, was
completed during the second quarter of 2007. Net sales, Gross profit, and Net income (loss) were
$1,648.5, $438.5 and $(42.9), respectively, for the Predecessor period from May 5, 2007 to July 6,
2007, and were $699.1, $184.7 and $(27.2), respectively, for the Successor period from March 6,
2007 to August 3, 2007. For comparison purposes, these Successor results include the results of
operations for BAC for the period prior to the merger from March 6, 2007 (its formation) through
July 6, 2007 (reflecting the change in fair value of interest rate swaps).
9