Dollar General 2009 Annual Report Download - page 75
Download and view the complete annual report
Please find page 75 of the 2009 Dollar General annual report below. You can navigate through the pages in the report by either clicking on the pages listed below, or by using the keyword search tool below to find specific information within the annual report.-
 1
1 -
2
-
3
-
4
-
5
-
6
-
7
-
8
-
9
-
10
-
11
-
12
-
13
-
14
-
15
-
16
-
17
-
18
-
19
-
20
-
21
-
22
-
23
-
24
-
25
-
26
-
27
-
28
-
29
-
30
-
31
-
32
-
33
-
34
-
35
-
36
-
37
-
38
-
39
-
40
-
41
-
42
-
43
-
44
-
45
-
46
-
47
-
48
-
49
-
50
-
51
-
52
-
53
-
54
-
55
-
56
-
57
-
58
-
59
-
60
-
61
-
62
-
63
-
64
-
 65
65 -
 66
66 -
 67
67 -
 68
68 -
 69
69 -
 70
70 -
 71
71 -
 72
72 -
 73
73 -
 74
74 -
 75
75 -
 76
76 -
 77
77 -
 78
78 -
 79
79 -
 80
80 -
 81
81 -
 82
82 -
 83
83 -
 84
84 -
 85
85 -
86
-
87
-
88
-
89
-
90
-
91
-
92
-
93
-
94
-
95
-
96
-
97
-
98
-
99
-
100
-
101
-
102
-
103
-
104
-
105
-
106
-
107
-
108
-
109
-
110
-
111
-
112
-
113
-
114
-
115
-
116
-
117
-
118
-
119
-
120
-
121
-
122
-
123
-
124
-
125
-
126
-
127
-
128
-
129
-
130
-
131
 |
 |
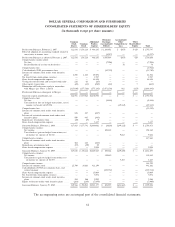
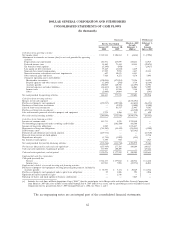
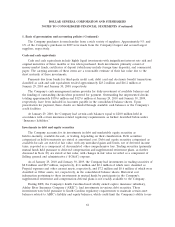
DOLLAR GENERAL CORPORATION AND SUBSIDIARIES
NOTES TO CONSOLIDATED FINANCIAL STATEMENTS (Continued)
1. Basis of presentation and accounting policies (Continued)
The Company purchases its merchandise from a wide variety of suppliers. Approximately 9% and
6% of the Company’s purchases in 2009 were made from the Company’s largest and second largest
suppliers, respectively.
Cash and cash equivalents
Cash and cash equivalents include highly liquid investments with insignificant interest rate risk and
original maturities of three months or less when purchased. Such investments primarily consist of
money market funds, certificates of deposit (which may include foreign time deposits), and commercial
paper. The carrying amounts of these items are a reasonable estimate of their fair value due to the
short maturity of these investments.
Payments due from banks for third-party credit card, debit card and electronic benefit transactions
classified as cash and cash equivalents totaled approximately $23.2 million and $16.2 million at
January 29, 2010 and January 30, 2009, respectively.
The Company’s cash management system provides for daily investment of available balances and
the funding of outstanding checks when presented for payment. Outstanding but unpresented checks
totaling approximately $159.6 million and $127.6 million at January 29, 2010 and January 30, 2009,
respectively, have been included in Accounts payable in the consolidated balance sheets. Upon
presentation for payment, these checks are funded through available cash balances or the Company’s
credit facilities.
At January 29, 2010, the Company had certain cash balances equal to $20.0 million held in
accordance with certain insurance-related regulatory requirements, as further described below under
‘‘Insurance liabilities.’’
Investments in debt and equity securities
The Company accounts for its investments in debt and marketable equity securities as
held-to-maturity, available-for-sale, or trading, depending on their classification. Debt securities
categorized as held-to-maturity are stated at amortized cost. Debt and equity securities categorized as
available-for-sale are stated at fair value, with any unrealized gains and losses, net of deferred income
taxes, reported as a component of Accumulated other comprehensive loss. Trading securities (primarily
mutual funds held pursuant to deferred compensation and supplemental retirement plans, as further
discussed in Note 10) are stated at fair value, with changes in fair value recorded as a component of
Selling, general and administrative (‘‘SG&A’’) expense.
As of January 29, 2010 and January 30, 2009, the Company had investments in trading securities of
$8.8 million and $8.7 million, respectively, $1.6 million and $2.1 million of which were classified as
Prepaid expenses and other current assets, respectively, and $7.2 million and $6.6 million of which were
classified as Other assets, net, respectively, in the consolidated balance sheets. Historical cost
information pertaining to these investments in mutual funds by participants in the Company’s
supplemental retirement and compensation deferral plans is not readily available to the Company.
During 2008, the Company’s South Carolina-based wholly owned captive insurance subsidiary,
Ashley River Insurance Company (‘‘ARIC’’), had investments in various debt securities. These
investments were held pursuant to South Carolina regulatory requirements to maintain certain asset
balances related to ARIC’s liability and equity balances, which could limit the Company’s ability to use
64