Dollar General 2009 Annual Report Download - page 121
Download and view the complete annual report
Please find page 121 of the 2009 Dollar General annual report below. You can navigate through the pages in the report by either clicking on the pages listed below, or by using the keyword search tool below to find specific information within the annual report.-
 1
1 -
2
-
3
-
4
-
5
-
6
-
7
-
8
-
9
-
10
-
11
-
12
-
13
-
14
-
15
-
16
-
17
-
18
-
19
-
20
-
21
-
22
-
23
-
24
-
25
-
26
-
27
-
28
-
29
-
30
-
31
-
32
-
33
-
34
-
35
-
36
-
37
-
38
-
39
-
40
-
41
-
42
-
43
-
44
-
45
-
46
-
47
-
48
-
49
-
50
-
51
-
52
-
53
-
54
-
55
-
56
-
57
-
58
-
59
-
60
-
61
-
62
-
63
-
64
-
65
-
66
-
67
-
68
-
69
-
70
-
71
-
72
-
73
-
74
-
75
-
76
-
77
-
78
-
79
-
80
-
81
-
82
-
83
-
84
-
85
-
86
-
87
-
88
-
89
-
90
-
91
-
92
-
93
-
94
-
95
-
96
-
97
-
98
-
99
-
100
-
101
-
102
-
103
-
104
-
105
-
106
-
107
-
108
-
109
-
110
-
 111
111 -
 112
112 -
 113
113 -
 114
114 -
 115
115 -
 116
116 -
 117
117 -
 118
118 -
 119
119 -
 120
120 -
 121
121 -
 122
122 -
 123
123 -
 124
124 -
 125
125 -
 126
126 -
 127
127 -
 128
128 -
 129
129 -
 130
130 -
 131
131
 |
 |

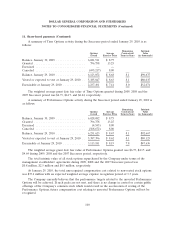
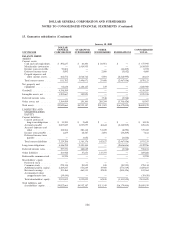
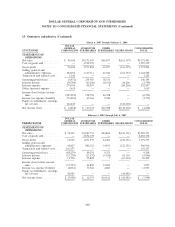
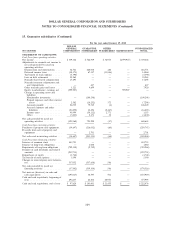
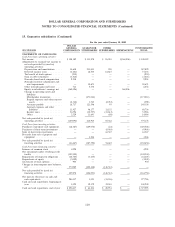
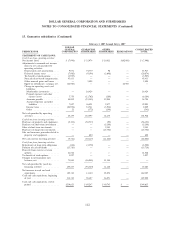
DOLLAR GENERAL CORPORATION AND SUBSIDIARIES
NOTES TO CONSOLIDATED FINANCIAL STATEMENTS (Continued)
15. Guarantor subsidiaries (Continued)
For the year ended January 30, 2009
DOLLAR
GENERAL GUARANTOR OTHER CONSOLIDATED
SUCCESSOR CORPORATION SUBSIDIARIES SUBSIDIARIES ELIMINATIONS TOTAL
STATEMENTS OF CASH FLOWS:
Cash flows from operating activities:
Net income .................. $108,182 $ 333,878 $ 26,218 $(360,096) $ 108,182
Adjustments to reconcile net income to
net cash provided by (used in)
operating activities:
Depreciation and amortization .... 34,638 213,003 258 — 247,899
Deferred income taxes ......... (4,681) 16,500 61,615 — 73,434
Tax benefit of stock options ...... (950) — — — (950)
Gain on debt retirement ........ (3,818) — — — (3,818)
Noncash share-based compensation . 9,958 — — — 9,958
Noncash inventory adjustments and
asset impairments ........... — 50,671 — — 50,671
Other noncash gains and losses .... 714 5,538 — — 6,252
Equity in subsidiaries’ earnings, net . (360,096) — — 360,096 —
Change in operating assets and
liabilities:
Merchandise inventories ....... — (173,014) — — (173,014)
Prepaid expenses and other current
assets ................. (2,310) 3,765 (2,053) — (598)
Accounts payable ........... 18,717 121,546 93 — 140,356
Accrued expenses and other
liabilities ............... 11,427 46,177 11,132 — 68,736
Income taxes .............. 56,596 (10,797) (11,813) — 33,986
Other .................. 2,529 11,643 (88) — 14,084
Net cash provided by (used in)
operating activities ............ (129,094) 618,910 85,362 — 575,178
Cash flows from investing activities:
Purchases of property and equipment . . (16,467) (189,058) (21) — (205,546)
Purchases of short-term investments . . — — (9,903) — (9,903)
Sales of short-term investments ..... — — 61,547 — 61,547
Proceeds from sale of property and
equipment ................. — 1,266 — — 1,266
Net cash provided by (used in)
investing activities ............ (16,467) (187,792) 51,623 — (152,636)
Cash flows from financing activities:
Issuance of common stock ........ 4,228 — — — 4,228
Net repayments under revolving credit
facility ................... (102,500) — — — (102,500)
Repayments of long-term obligations . . (40,780) (3,645) — — (44,425)
Repurchases of equity ........... (3,009) — — — (3,009)
Tax benefit of stock options ........ 950 — — — 950
Changes in intercompany note balances,
net...................... 570,989 (422,448) (148,541) — —
Net cash provided by (used in)
financing activities ............ 429,878 (426,093) (148,541) — (144,756)
Net increase (decrease) in cash and
cash equivalents ............. 284,317 5,025 (11,556) — 277,786
Cash and cash equivalents, beginning of
year ..................... 8,320 59,379 32,510 — 100,209
Cash and cash equivalents, end of year . $ 292,637 $ 64,404 $ 20,954 $ — $ 377,995
110