Dollar General 2009 Annual Report Download - page 59
Download and view the complete annual report
Please find page 59 of the 2009 Dollar General annual report below. You can navigate through the pages in the report by either clicking on the pages listed below, or by using the keyword search tool below to find specific information within the annual report.-
 1
1 -
2
-
3
-
4
-
5
-
6
-
7
-
8
-
9
-
10
-
11
-
12
-
13
-
14
-
15
-
16
-
17
-
18
-
19
-
20
-
21
-
22
-
23
-
24
-
25
-
26
-
27
-
28
-
29
-
30
-
31
-
32
-
33
-
34
-
35
-
36
-
37
-
38
-
39
-
40
-
41
-
42
-
43
-
44
-
45
-
46
-
47
-
48
-
 49
49 -
 50
50 -
 51
51 -
 52
52 -
 53
53 -
 54
54 -
 55
55 -
 56
56 -
 57
57 -
 58
58 -
 59
59 -
 60
60 -
 61
61 -
 62
62 -
 63
63 -
 64
64 -
 65
65 -
 66
66 -
 67
67 -
 68
68 -
 69
69 -
70
-
71
-
72
-
73
-
74
-
75
-
76
-
77
-
78
-
79
-
80
-
81
-
82
-
83
-
84
-
85
-
86
-
87
-
88
-
89
-
90
-
91
-
92
-
93
-
94
-
95
-
96
-
97
-
98
-
99
-
100
-
101
-
102
-
103
-
104
-
105
-
106
-
107
-
108
-
109
-
110
-
111
-
112
-
113
-
114
-
115
-
116
-
117
-
118
-
119
-
120
-
121
-
122
-
123
-
124
-
125
-
126
-
127
-
128
-
129
-
130
-
131
 |
 |
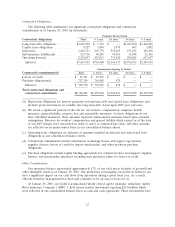
held pursuant to South Carolina regulatory requirements to maintain certain asset balances which could
limit our ability to use these assets for general corporate purposes.
As described in Note 9 to the Consolidated Financial Statements, we are involved in a number of
legal actions and claims, some of which could potentially result in material cash payments. Adverse
developments in those actions could materially and adversely affect our liquidity. As discussed in
Note 6 we also have certain income tax-related contingencies. Future negative developments could have
a material adverse effect on our liquidity.
On December 10, 2009, Standard & Poor’s upgraded our long-term debt rating to BB from B+
with a stable outlook and on December 17, 2009, Moody’s upgraded our long-term debt rating to B1
from B2 with a stable outlook. These current ratings are considered non-investment grade. Our current
credit ratings, as well as future rating agency actions, could (1) impact our ability to obtain financings
to finance our operations on satisfactory terms; (2) affect our financing costs; and (3) affect our
insurance premiums and collateral requirements necessary for our self-insured programs.
Cash flows
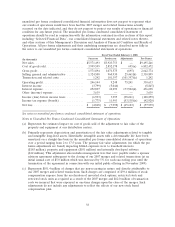
Cash flows from operating activities. A significant component of our increase in cash flows from
operating activities in 2009 compared to 2008 was the increase in net income due to greater sales,
higher gross margins and lower SG&A expenses as a percentage of sales, as described in more detail
above under ‘‘Results of Operations.’’ In addition, we experienced increased inventory turns in 2009 as
compared to 2008. Changes in inventory balances increased by 7% in 2009 compared to an increase of
10% in 2008. Inventory levels in the consumables category increased by $111.4 million, or 15%, in 2009
compared to an increase of $77.8 million, or 12%, in 2008. The seasonal category increased by
$25.3 million, or 9%, in 2009 compared to an increase of $20.9 million, or 8%, in 2008. The home
products category declined $9.1 million, or 6%, in 2009 compared to a decline of $2.6 million, or 2%,
in 2008. The apparel category declined by $22.9 million, or 10%, in 2009 compared to an increase of
$30.2 million, or 15%, in 2008. In addition, increased net income in 2009 compared to 2008 was a
principal factor in the increase in income taxes paid in 2009 compared to 2008. Changes in Accrued
expenses and other were affected in part by the timing of the payments related to the Litigation
settlement and related costs discussed above under ‘‘Results of Operations,’’ as the insurance proceeds
of $10.0 million were received at the end of 2008 while the payment of the $40.0 million settlement
occurred at the beginning of 2009.
A significant component of the change in cash flows from operating activities in 2008 compared to
the 2007 periods was our strong operating performance due to greater sales, higher gross margins and
lower SG&A expenses as a percentage of sales, partially offset by significantly higher interest expense,
as described in more detail above under ‘‘Results of Operations.’’ In addition, we experienced increased
inventory turns and improved merchandise payment terms in 2008 as compared to the 2007 periods.
Accounts payable balances increased by $140.4 million in 2008 compared to a decline of $41.4 million
in the 2007 Successor period and an increase of $34.8 million in the 2007 Predecessor period partially
as a result of our implementation of initiatives to aggressively manage our payables. Also positively
affecting cash flows from operations were increases in accrued expenses and other in 2008, which was
primarily attributable to increases in litigation reserves, incentive bonus accruals, deferred vendor
rebates, and property and sales tax accruals. Other significant components of the change in cash flows
from operating activities in 2008 as compared to 2007 were changes in inventory balances, which
increased by 10% in 2008 compared to decreases of approximately 6% and 1% during the 2007
Successor and Predecessor periods, respectively. Inventory levels in the consumables category increased
by $77.8 million, or 12%, in 2008 compared to a decline of $90.7 million, or 12%, in the 2007
Successor period and an increase of $48.8 million, or 7%, in the 2007 Predecessor period. The seasonal
category increased by $20.9 million, or 8%, in 2008 compared to a decline of $24.2 million, or 8%, in
the 2007 Successor period and a decline of $38.7 million, or 11%, in the 2007 Predecessor period. The
48