Dollar General 2009 Annual Report Download - page 60
Download and view the complete annual report
Please find page 60 of the 2009 Dollar General annual report below. You can navigate through the pages in the report by either clicking on the pages listed below, or by using the keyword search tool below to find specific information within the annual report.-
 1
1 -
2
-
3
-
4
-
5
-
6
-
7
-
8
-
9
-
10
-
11
-
12
-
13
-
14
-
15
-
16
-
17
-
18
-
19
-
20
-
21
-
22
-
23
-
24
-
25
-
26
-
27
-
28
-
29
-
30
-
31
-
32
-
33
-
34
-
35
-
36
-
37
-
38
-
39
-
40
-
41
-
42
-
43
-
44
-
45
-
46
-
47
-
48
-
49
-
 50
50 -
 51
51 -
 52
52 -
 53
53 -
 54
54 -
 55
55 -
 56
56 -
 57
57 -
 58
58 -
 59
59 -
 60
60 -
 61
61 -
 62
62 -
 63
63 -
 64
64 -
 65
65 -
 66
66 -
 67
67 -
 68
68 -
 69
69 -
 70
70 -
71
-
72
-
73
-
74
-
75
-
76
-
77
-
78
-
79
-
80
-
81
-
82
-
83
-
84
-
85
-
86
-
87
-
88
-
89
-
90
-
91
-
92
-
93
-
94
-
95
-
96
-
97
-
98
-
99
-
100
-
101
-
102
-
103
-
104
-
105
-
106
-
107
-
108
-
109
-
110
-
111
-
112
-
113
-
114
-
115
-
116
-
117
-
118
-
119
-
120
-
121
-
122
-
123
-
124
-
125
-
126
-
127
-
128
-
129
-
130
-
131
 |
 |
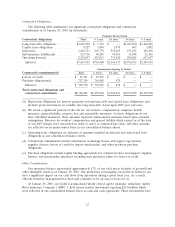
home products category declined by $2.6 million, or 2%, in 2008 compared to an increase of
$25.4 million, or 19%, in the 2007 Successor period and a decline of $15.0 million, or 10%, in the 2007
Predecessor period. The apparel category increased by $30.2 million, or 15%, in 2008 compared to an
increase of $10.0 million, or 5%, in the 2007 Successor period and a decline of $11.5 million, or 5%, in
the 2007 Predecessor period. In addition, net income in 2008 compared to the net losses in the 2007
periods discussed above was a principal factor in the increase in income taxes paid in 2008. Income tax
refunds received in 2007 for taxes paid in prior years that did not reoccur in 2008 also contributed to
the increase in income taxes paid during 2008.
Cash flows from investing activities. Cash flows used in investing activities totaling $248.0 million in
2009 were primarily related to capital expenditures. Significant components of our property and
equipment purchases in 2009 included the following approximate amounts: $114 million for
improvements, upgrades, remodels and relocations of existing stores; $69 million for new stores;
$28 million for distribution and transportation-related capital expenditures; $24 million for various
administrative capital costs; and $11 million for information systems upgrades and technology-related
projects. During 2009 we opened 500 new stores and remodeled or relocated 450 stores.
Cash flows used in investing activities totaling $152.6 million in 2008 were primarily related to
capital expenditures, offset by sales of investments. Significant components of our property and
equipment purchases in 2008 included the following approximate amounts: $149 million for
improvements, upgrades, remodels and relocations of existing stores; $22 million for new stores;
$17 million for distribution and transportation-related capital expenditures; and $13 million for
information systems upgrades and technology-related projects. During 2008 we opened 207 new stores
and remodeled or relocated 404 stores.
Purchases and sales of short-term investments equal to net sales of $51.6 million in 2008 primarily
reflected investment activities in our captive insurance subsidiary.
Our 2007 merger, as discussed in more detail above, required cash payments in the 2007 Successor
period of approximately $6.7 billion, net of cash acquired of $350 million. Significant components of
property and equipment purchases in the 2007 Successor period included the following approximate
amounts: $45 million for improvements, upgrades, remodels and relocations of existing stores;
$23 million for distribution and transportation-related capital expenditures; and $16 million for new
stores. During the 2007 Successor period, we opened 170 new stores and remodeled or relocated
235 stores. Significant components of property and equipment purchases in the 2007 Predecessor period
included the following approximate amounts: $29 million for new stores; $15 million for improvements,
upgrades, remodels and relocations of existing stores; and $7 million for distribution and
transportation-related capital expenditures. During the 2007 Predecessor period, we opened 195 new
stores and remodeled or relocated 65 stores.
During the 2007 Successor period we purchased a secured promissory note for $37.0 million which
represents debt issued by a third-party entity from which we lease our distribution center in Ardmore,
Oklahoma. Purchases and sales of short-term investments, which equaled net sales of $17.6 million and
$4.4 million in the respective 2007 Successor and Predecessor periods, primarily reflect our investment
activities in our captive insurance subsidiary, and all purchases of long-term investments were related to
the captive insurance subsidiary.
Capital expenditures during 2010 are projected to be in the range of $325-$350 million. We
anticipate funding 2010 capital requirements with cash flows from operations, and if necessary, we also
have significant availability under our ABL Facility. Significant components of the 2010 capital plan
include growth initiatives, including leasehold improvements, fixtures and equipment for approximately
600 new stores; continued investment in our existing store base with plans for remodeling and
relocating approximately 500 stores; and additional investments in our supply chain and information
technology. We plan to undertake these expenditures in order to improve our infrastructure and
increase our cash generated from operating activities.
49