Dollar General 2009 Annual Report Download - page 16
Download and view the complete annual report
Please find page 16 of the 2009 Dollar General annual report below. You can navigate through the pages in the report by either clicking on the pages listed below, or by using the keyword search tool below to find specific information within the annual report.-
 1
1 -
2
-
3
-
4
-
5
-
 6
6 -
 7
7 -
 8
8 -
 9
9 -
 10
10 -
 11
11 -
 12
12 -
 13
13 -
 14
14 -
 15
15 -
 16
16 -
 17
17 -
 18
18 -
 19
19 -
 20
20 -
 21
21 -
 22
22 -
 23
23 -
 24
24 -
 25
25 -
 26
26 -
27
-
28
-
29
-
30
-
31
-
32
-
33
-
34
-
35
-
36
-
37
-
38
-
39
-
40
-
41
-
42
-
43
-
44
-
45
-
46
-
47
-
48
-
49
-
50
-
51
-
52
-
53
-
54
-
55
-
56
-
57
-
58
-
59
-
60
-
61
-
62
-
63
-
64
-
65
-
66
-
67
-
68
-
69
-
70
-
71
-
72
-
73
-
74
-
75
-
76
-
77
-
78
-
79
-
80
-
81
-
82
-
83
-
84
-
85
-
86
-
87
-
88
-
89
-
90
-
91
-
92
-
93
-
94
-
95
-
96
-
97
-
98
-
99
-
100
-
101
-
102
-
103
-
104
-
105
-
106
-
107
-
108
-
109
-
110
-
111
-
112
-
113
-
114
-
115
-
116
-
117
-
118
-
119
-
120
-
121
-
122
-
123
-
124
-
125
-
126
-
127
-
128
-
129
-
130
-
131
 |
 |
results during 2008 and 2009 reflect the favorable outcome of many of these initiatives, and we believe
that we can build on our recent strong financial results by continuing to enhance these initiatives which
include:
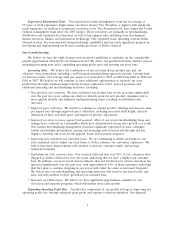
•Merchandising. We continue to improve the overall profitability of our merchandising decisions.
Our category management processes have resulted in improved product selection and pricing
decisions, contributing to our improved gross profit margins. We plan to expand our category
management processes, with the intent of positively impacting our overall sales and operating
profit rates.
•Sourcing. In 2009, we imported approximately $629 million of goods, or 8% of total purchases at
cost. We believe we have the potential to directly source a larger portion of our products at
significant savings to current costs. We are currently increasing our direct foreign sourcing
efforts, which we believe offer significant opportunity for gross profit enhancement in the future.
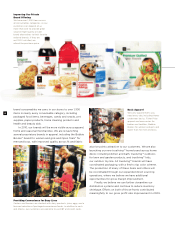
•Private brand. Improving the consistency, quality, appearance and breadth of our private brand
offerings has yielded increased penetration over the past two years, and we intend to continue to
drive our private brand penetration going forward. Generally, private brand items have higher
gross profit margins than similar national brand items. Our private brand program complements
our model of offering customers nationally branded merchandise at everyday low prices. Since
2007, we have added approximately 700 net new private brand items, predominantly in
consumables, increasing our total number of such items to approximately 1,300 SKUs. As a
percentage of consumables sales, we increased private brand penetration from approximately
17% in 2007 to approximately 21% in 2009. We expect to expand on these efforts in the future
in addition to greatly increasing the role of private brands in our non-consumable offerings.
•Inventory shrink rate reduction. The reduction in shrink rate since 2007 has played a key role in
increasing our gross profit margin. The reduction is the result of the focus and relentless efforts
of our field management team and the introduction of improved indicator metrics at the stores,
in conjunction with improved hiring and training practices, and lower store manager turnover.
We continue to improve and automate our shrink indicator tools, and we believe we have
opportunity for further shrink improvement.
•Other cost reduction efforts. We continually look for ways to improve our cost structure and
enhance efficiencies throughout the organization. Significant current cost reduction efforts
include implementing additional safety measures to further reduce workers’ compensation and
general liability insurance costs, identifying additional efficiencies in distribution and
transportation, labor productivity initiatives, continuing our store rent reduction work,
implementing more energy management tools and programs, expanding our recycling efforts and
improving employee retention.
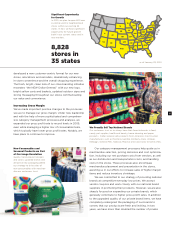
Growing Our Store Base. Based on a detailed, market-by-market analysis, we believe we have
significant potential to increase our number of stores in existing and new markets. Our recent market
analysis suggests there are as many as 12,000 opportunities, the majority of which are located in the 35
states where we currently operate. Also included are significant opportunities to open stores in new
markets, most notably in states on the Pacific coast and in certain areas of the Northeast. Based on the
initial successes of our 2008 and 2009 new store openings, we have confidence in our real estate
disciplines and in our ability to identify, open and operate successful new stores. As a result, we believe
that at least our present level of new store growth is sustainable for the foreseeable future. In addition,
we also believe that in the current real estate market environment there may be opportunities to
negotiate lower rent and construction costs and to improve the overall quality of our sites at attractive
rental rates, increasing our opportunity to improve profitability.
5