Chevron 2014 Annual Report Download - page 79
Download and view the complete annual report
Please find page 79 of the 2014 Chevron annual report below. You can navigate through the pages in the report by either clicking on the pages listed below, or by using the keyword search tool below to find specific information within the annual report.-
 1
1 -
2
-
3
-
4
-
5
-
6
-
7
-
8
-
9
-
10
-
11
-
12
-
13
-
14
-
15
-
16
-
17
-
18
-
19
-
20
-
21
-
22
-
23
-
24
-
25
-
26
-
27
-
28
-
29
-
30
-
31
-
32
-
33
-
34
-
35
-
36
-
37
-
38
-
39
-
40
-
41
-
42
-
43
-
44
-
45
-
46
-
47
-
48
-
49
-
50
-
51
-
52
-
53
-
54
-
55
-
56
-
57
-
58
-
59
-
60
-
61
-
62
-
63
-
64
-
65
-
66
-
67
-
68
-
 69
69 -
 70
70 -
 71
71 -
 72
72 -
 73
73 -
 74
74 -
 75
75 -
 76
76 -
 77
77 -
 78
78 -
 79
79 -
 80
80 -
 81
81 -
 82
82 -
 83
83 -
 84
84 -
 85
85 -
 86
86 -
 87
87 -
 88
88
 |
 |

Supplemental Information on Oil and Gas Producing Activities - Unaudited
Extensions and Discoveries In 2012, extensions and discoveries increased reserves 101 million barrels in Other Americas,
primarily due to the initial booking of the Hebron project in Canada. In the United States, additions at several Gulf of Mexico
projects and drilling activities in the mid-continent region were primarily responsible for the 77 million barrel increase.
In 2013, extensions and discoveries in the Midland and Delaware basins were primarily responsible for the 55 million barrel
increase in the United States.
In 2014, extensions and discoveries in the Midland and Delaware basins and the Gulf of Mexico were primarily responsible
for the 164 million barrel increase in the United States.
Purchases In 2014, the purchase of additional reserves in Canada was responsible for the 26 million barrel increase in
synthetic oil.
Sales In 2014, the sale of the company’s interests in Chad was responsible for the 20 million barrel decrease in Africa.
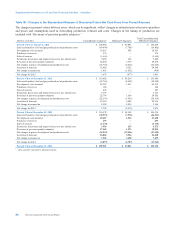
Net Proved Reserves of Crude Oil, Condensate, Natural Gas Liquids and Synthetic Oil
Consolidated Companies Affiliated Companies Total
Consolidated
and Affiliated
CompaniesMillions of barrels U.S.
Other
Americas1Africa Asia
Australia/
Oceania Europe
Synthetic
Oil2Total TCO
Synthetic
Oil Other3
Reserves at January 1, 2012 1,311 113 1,155 894 140 159 523 4,295 1,759 244 157 6,455
Changes attributable to:
Revisions 104 20 66 97 4 16 6 313 59 (6) 24 390
Improved recovery 24 8 30 6 — 9 — 77 — — — 77
Extensions and discoveries 77 101 30 2 7 — — 217 — — 1 218
Purchases 10 — — — — — — 10 — — — 10
Sales (1) — — (15) (7) — — (23) — — — (23)
Production (166) (19) (151) (147) (10) (27) (16) (536) (86) (6) (18) (646)
Reserves at December 31, 201241,359 223 1,130 837 134 157 513 4,353 1,732 232 164 6,481
Changes attributable to:
Revisions 55 25 94 84 7 17 40 322 32 (3) 3 354
Improved recovery 26 — 10 10 — 11 — 57 — — — 57
Extensions and discoveries 55 4 13 2 — 4 — 78 — — — 78
Purchases 2 9 — — — — — 11 — — — 11
Sales (3) — (1) — — — — (4) — — — (4)
Production (164) (18) (142) (141) (10) (23) (16) (514) (96) (9) (13) (632)
Reserves at December 31, 201341,330 243 1,104 792 131 166 537 4,303 1,668 220 154 6,345
Changes attributable to:
Revisions 90 — 74 80 19 9 (32) 240 41 (4) — 277
Improved recovery 19 1 1 8 — 5 — 34 — — — 34
Extensions and discoveries 164 18 2 7 — 8 19 218 — — 1 219
Purchases 1 — — — — — 26 27 — — — 27
Sales (6) — (20) — — (3) — (29) — — — (29)
Production (166) (24) (140) (135) (8) (19) (16) (508) (94) (12) (10) (624)
Reserves at December 31, 201441,432 238 1,021 752 142 166 534 4,285 1,615 204 145 6,249
1Ending reserve balances in North America were 142, 141 and 121 and in South America were 96, 102 and 102 in 2014, 2013 and 2012, respectively.
2Reserves associated with Canada.
3Ending reserve balances in Africa were 37, 37 and 41 and in South America were 108, 117 and 123 in 2014, 2013 and 2012, respectively.
4Included are year-end reserve quantities related to production-sharing contracts (PSC). PSC-related reserve quantities are 19 percent, 20 percent and 20 percent for consolidated
companies for 2014, 2013 and 2012, respectively.
Chevron Corporation 2014 Annual Report 77