Chevron 2014 Annual Report Download - page 23
Download and view the complete annual report
Please find page 23 of the 2014 Chevron annual report below. You can navigate through the pages in the report by either clicking on the pages listed below, or by using the keyword search tool below to find specific information within the annual report.-
 1
1 -
2
-
3
-
4
-
5
-
6
-
7
-
8
-
9
-
10
-
11
-
12
-
 13
13 -
 14
14 -
 15
15 -
 16
16 -
 17
17 -
 18
18 -
 19
19 -
 20
20 -
 21
21 -
 22
22 -
 23
23 -
 24
24 -
 25
25 -
 26
26 -
 27
27 -
 28
28 -
 29
29 -
 30
30 -
 31
31 -
 32
32 -
 33
33 -
34
-
35
-
36
-
37
-
38
-
39
-
40
-
41
-
42
-
43
-
44
-
45
-
46
-
47
-
48
-
49
-
50
-
51
-
52
-
53
-
54
-
55
-
56
-
57
-
58
-
59
-
60
-
61
-
62
-
63
-
64
-
65
-
66
-
67
-
68
-
69
-
70
-
71
-
72
-
73
-
74
-
75
-
76
-
77
-
78
-
79
-
80
-
81
-
82
-
83
-
84
-
85
-
86
-
87
-
88
 |
 |

Management’s Discussion and Analysis of Financial Condition and Results of Operations
The company’s future debt level is dependent primarily on results of operations, the capital program and cash that may be
generated from asset dispositions. Based on its high-quality debt ratings, the company believes that it has substantial
borrowing capacity to meet unanticipated cash requirements. During extended periods of low prices for crude oil and natural
gas and narrow margins for refined products and commodity chemicals, the company can also modify capital spending plans
to provide flexibility to continue paying the common stock dividend and with the intent to maintain the company’s high-
quality debt ratings.
Committed Credit Facilities Information related to committed credit facilities is included in Note 18 to the Consolidated
Financial Statements, Short-Term Debt, on page 57.
Common Stock Repurchase Program In July 2010, the Board of Directors approved an ongoing share repurchase program
with no set term or monetary limits. During 2014, the company purchased 41.5 million common shares for $5.0 billion. From
the inception of the program through 2014, the company had purchased 180.9 million shares for $20.0 billion. Given the
change in market conditions, the company is suspending the share repurchase program for 2015.
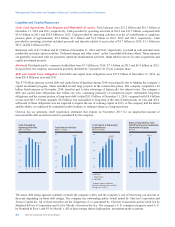
Capital and Exploratory Expenditures
Capital and exploratory expenditures by business segment for 2014, 2013 and 2012 are as follows:
2014 2013 2012
Millions of dollars U.S. Int’l. Total U.S. Int’l. Total U.S. Int’l. Total
Upstream $ 8,799 $ 28,316 $37,115 $ 8,480 $ 29,378 $37,858 $ 8,531 $ 21,913 $30,444
Downstream 1,649 941 2,590 1,986 1,189 3,175 1,913 1,259 3,172
All Other 584 27 611 821 23 844 602 11 613
Total $ 11,032 $ 29,284 $40,316 $ 11,287 $ 30,590 $41,877 $ 11,046 $ 23,183 $ 34,229
Total, Excluding Equity in Affiliates $ 10,011 $ 26,838 $36,849 $ 10,562 $ 28,617 $39,179 $ 10,738 $ 21,374 $ 32,112
Total expenditures for 2014 were $40.3 billion, including $3.5 billion for the company’s share of equity-affiliate
expenditures, which did not require cash outlays by the company. In 2013 and 2012, expenditures were $41.9 billion and
$34.2 billion, respectively, including the company’s share of affiliates’ expenditures of $2.7 billion and $2.1 billion,
respectively. The increase in expenditures between 2013 and 2012 included approximately $4 billion for major resource
acquisitions in Argentina, Australia, the Permian Basin and the Kurdistan Region of Iraq, along with the additional acreage in
the Duvernay Shale and interests in the Kitimat LNG Project. In addition, work progressed on a number of major capital
projects, particularly two Australian LNG projects and two deepwater Gulf of Mexico projects.
Of the $40.3 billion of expenditures in 2014, 92 percent, or $37.1 billion, was related to upstream activities. Approximately,
90 percent was expended for upstream operations in 2013 and 2012. International upstream accounted for 76 percent of the
worldwide upstream investment in 2014, 78 percent in 2013 and 72 percent in 2012.
The company estimates that 2015 capital and exploratory expenditures will be $35.0 billion, including $4.0 billion of
spending by affiliates. This planned reduction, compared to 2014 expenditures, is in large part a response to current market
conditions. Approximately 90 percent of the total, or $31.6 billion, is budgeted for exploration and production activities.
Approximately $23.4 billion, or 74 percent, of this amount is for projects outside the United States. Spending in 2015 is
primarily focused on major development projects in Angola, Argentina, Australia, Canada, Kazakhstan, Nigeria, Republic of
the Congo, Russia, the United Kingdom and the U.S. Also included is funding for enhancing recovery and mitigating natural
field declines for currently-producing assets, development of shale and tight resources, and focused exploration and appraisal
activities. The company will continue to monitor crude oil market conditions, and will further modify spending plans, as
needed.
Worldwide downstream spending in 2015 is estimated at $2.8 billion, with $2.0 billion for projects in the United States.
About half of these investments are expected to be funded by CPChem for petrochemicals projects in the United States.
Additional capital outlays include projects at U.S. and international refineries.
Investments in technology companies and other corporate businesses in 2015 are budgeted at $0.6 billion.
Noncontrolling Interests The company had noncontrolling interests of $1.2 billion at December 31, 2014 compared to $1.3
billion at year-end 2013. Distributions to noncontrolling interests totaled $47 million and $99 million in 2014 and 2013,
respectively.
Pension Obligations Information related to pension plan contributions is included on page 64 in Note 22 to the Consolidated
Financial Statements under the heading “Cash Contributions and Benefit Payments.”
Chevron Corporation 2014 Annual Report 21