Chevron 2014 Annual Report Download - page 14
Download and view the complete annual report
Please find page 14 of the 2014 Chevron annual report below. You can navigate through the pages in the report by either clicking on the pages listed below, or by using the keyword search tool below to find specific information within the annual report.-
 1
1 -
2
-
3
-
 4
4 -
 5
5 -
 6
6 -
 7
7 -
 8
8 -
 9
9 -
 10
10 -
 11
11 -
 12
12 -
 13
13 -
 14
14 -
 15
15 -
 16
16 -
 17
17 -
 18
18 -
 19
19 -
 20
20 -
 21
21 -
 22
22 -
 23
23 -
 24
24 -
25
-
26
-
27
-
28
-
29
-
30
-
31
-
32
-
33
-
34
-
35
-
36
-
37
-
38
-
39
-
40
-
41
-
42
-
43
-
44
-
45
-
46
-
47
-
48
-
49
-
50
-
51
-
52
-
53
-
54
-
55
-
56
-
57
-
58
-
59
-
60
-
61
-
62
-
63
-
64
-
65
-
66
-
67
-
68
-
69
-
70
-
71
-
72
-
73
-
74
-
75
-
76
-
77
-
78
-
79
-
80
-
81
-
82
-
83
-
84
-
85
-
86
-
87
-
88
 |
 |

Management’s Discussion and Analysis of Financial Condition and Results of Operations
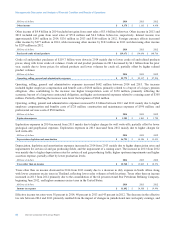
A differential in crude oil prices exists between high-quality (high-gravity, low-sulfur) crudes and those of lower quality
(low-gravity, high-sulfur). The amount of the differential in any period is associated with the supply of heavy crude versus
the demand, which is a function of the capacity of refineries that are able to process this lower quality feedstock into light
products (motor gasoline, jet fuel, aviation gasoline and diesel fuel). After peaking early in second quarter 2014, the
differential has eased in North America as refinery crude runs remained at or above record levels. Outside of North America,
easing of geopolitical tensions and continued expansion of supply of light sweet crudes has pressured light sweet crude prices
relative to those for heavier, more sour crudes.
Chevron produces or shares in the production of heavy crude oil in California, Indonesia, the Partitioned Zone between Saudi
Arabia and Kuwait, Venezuela and in certain fields in Angola, China and the United Kingdom sector of the North Sea. (See
page 19 for the company’s average U.S. and international crude oil realizations.)
In contrast to price movements in the global market for crude oil, price changes for natural gas in many regional markets are
more closely aligned with supply-and-demand conditions in those markets. Fluctuations in the price of natural gas in the
United States are closely associated with customer demand relative to the volumes produced and stored in North America. In
the United States, prices at Henry Hub averaged $4.28 per thousand cubic feet (MCF) during 2014, compared with $3.70
during 2013. As of mid-February 2015, the Henry Hub spot price was $2.73 per MCF.
Outside the United States, price changes for natural gas depend on a wide range of supply, demand, regulatory and
commercial factors. In some locations, Chevron is investing in long-term projects to install infrastructure to produce and
liquefy natural gas for transport by tanker to other markets. The company’s contract prices for liquefied natural gas (LNG)
are typically linked to crude oil prices. Chevron’s international natural gas realizations averaged $5.78 per MCF during 2014,
compared with $5.91 per MCF during 2013. (See page 19 for the company’s average natural gas realizations for the U.S. and
international regions.)
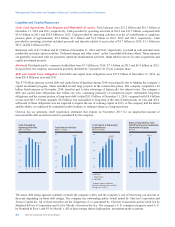
0
5500
4400
1100
2200
3300
Net Natural Gas Production*
Millions of cubic feet per day
United States
International
*Includes equity in affiliates.
1110 12 13 14
5,167
0
2000
1600
1200
800
400
Net Liquids Production*
Thousands of barrels per day
United States
International
*Includes equity in affiliates.
1110 12 13 14
1,709
0.0
12.5
7.5
5.0
10.0
2.5
Net Proved Reserves
Billions of BOE
United States
Other Americas
Africa
Asia
Australia
Europe
Affiliates
11.1
10 11
12
13
14
Net Proved Reserves
Liquids vs. Natural Gas
Billions of BOE
1110 12 13 14
11.1
Natural Gas
Liquids
12.5
7.5
0.0
10.0
5.0
2.5
The company’s worldwide net oil-equivalent production in 2014 averaged 2.571 million million barrels per day. About one-
fifth of the company’s net oil-equivalent production in 2014 occurred in the OPEC-member countries of Angola, Nigeria,
Venezuela and the Partitioned Zone between Saudi Arabia and Kuwait. OPEC quotas had no effect on the company’s net
crude oil production in 2014 or 2013. At their November 2014 meeting, members of OPEC supported maintaining the current
production quota of 30 million barrels per day, which has been in effect since December 2008.
The company estimates that oil-equivalent production in 2015 will be flat to 3 percent growth compared to 2014. This
estimate is subject to many factors and uncertainties, including the duration of the low price environment that began in
second-half 2014; quotas that may be imposed by OPEC; price effects on entitlement volumes; changes in fiscal terms or
restrictions on the scope of company operations; delays in construction, start-up or ramp-up of projects; fluctuations in
demand for natural gas in various markets; weather conditions that may shut in production; civil unrest; changing
geopolitics; delays in completion of maintenance turnarounds; greater-than-expected declines in production from mature
12 Chevron Corporation 2014 Annual Report