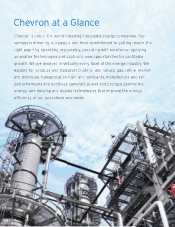
Chevron 2014 Annual Report Download - page 18
Download and view the complete annual report
Please find page 18 of the 2014 Chevron annual report below. You can navigate through the pages in the report by either clicking on the pages listed below, or by using the keyword search tool below to find specific information within the annual report.-
 1
1 -
2
-
3
-
4
-
5
-
6
-
7
-
 8
8 -
 9
9 -
 10
10 -
 11
11 -
 12
12 -
 13
13 -
 14
14 -
 15
15 -
 16
16 -
 17
17 -
 18
18 -
 19
19 -
 20
20 -
 21
21 -
 22
22 -
 23
23 -
 24
24 -
 25
25 -
 26
26 -
 27
27 -
 28
28 -
29
-
30
-
31
-
32
-
33
-
34
-
35
-
36
-
37
-
38
-
39
-
40
-
41
-
42
-
43
-
44
-
45
-
46
-
47
-
48
-
49
-
50
-
51
-
52
-
53
-
54
-
55
-
56
-
57
-
58
-
59
-
60
-
61
-
62
-
63
-
64
-
65
-
66
-
67
-
68
-
69
-
70
-
71
-
72
-
73
-
74
-
75
-
76
-
77
-
78
-
79
-
80
-
81
-
82
-
83
-
84
-
85
-
86
-
87
-
88
 |
 |

Management’s Discussion and Analysis of Financial Condition and Results of Operations
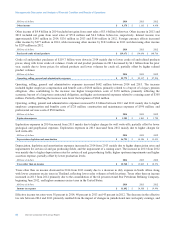
International Upstream
Millions of dollars 2014 2013 2012
Earnings*$ 13,566 $ 16,765 $ 18,456
*Includes foreign currency effects: $ 597 $ 559 $ (275)
International upstream earnings were $13.6 billion in 2014 compared with $16.8 billion in 2013. The decrease between
periods was primarily due to lower crude oil prices and sales volumes of $2.0 billion and $400 million, respectively. Also
contributing to the decrease were higher depreciation expenses of $1.0 billion, mainly related to impairments and other asset
writeoffs, and higher operating and tax expenses of $340 million and $310 million, respectively. Partially offsetting these
items were gains on asset sales of $1.1 billion in 2014, compared with $140 million in 2013. Foreign currency effects
increased earnings by $597 million in 2014, compared with an increase of $559 million a year earlier.
International upstream earnings were $16.8 billion in 2013 compared with $18.5 billion in 2012. The decrease was mainly
due to the absence of 2012 gains of approximately $1.4 billion on an asset exchange in Australia and $600 million on the sale
of an equity interest in the Wheatstone Project, lower crude oil prices of $500 million, and higher operating expense of $400
million. Partially offsetting these effects were lower income tax expenses of $430 million. Foreign currency effects increased
earnings by $559 million in 2013, compared with a decrease of $275 million a year earlier.
The company’s average realization for international crude oil and natural gas liquids in 2014 was $90.42 per barrel,
compared with $100.26 in 2013 and $101.88 in 2012. The average natural gas realization was $5.78 per thousand cubic feet
in 2014, compared with $5.91 and $5.99 in 2013 and 2012, respectively.
International net oil-equivalent production was 1.91 million barrels per day in 2014, a decrease of 2 percent from 2013 and
2012. Production increases due to project ramp-ups in Nigeria, Argentina and Brazil in 2014 were more than offset by
normal field declines, production entitlement effects in several locations and the effect of asset sales. The decline between
2013 and 2012 was a result of project ramp-ups in Nigeria and Angola in 2013 being more than offset by normal field
declines.
The net liquids component of international oil-equivalent production was 1.25 million barrels per day in 2014, a decrease of
approximately 2 percent from 2013 and a decrease of approximately 4 percent from 2012. International net natural gas
production of 3.9 billion cubic feet per day in 2014 was down 1 percent from 2013 and up 1 percent from 2012.
Refer to the “Selected Operating Data” table, on page 19, for a three-year comparative of international production
volumes.
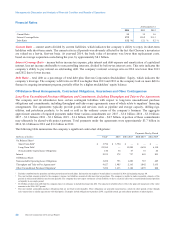
U.S. Downstream
Millions of dollars 2014 2013 2012
Earnings $ 2,637 $ 787 $ 2,048
U.S. downstream operations earned $2.6 billion in 2014, compared with $787 million in 2013. Higher margins on refined
product sales increased earnings $830 million. Gains from asset sales were $960 million in 2014, compared with $250
million a year earlier. Higher earnings from 50 percent-owned CPChem of $160 million and lower operating expenses of $80
million also contributed to the earnings increase.
U.S. downstream operations earned $787 million in 2013, compared with $2.0 billion in 2012. The decrease was mainly due
to lower margins on refined product sales of $860 million and higher operating expenses of $600 million, reflecting repair
and maintenance activities at the company’s refineries. The decrease was partially offset by higher earnings of $150 million
from 50 percent-owned CPChem.
Refined product sales of 1.21 million barrels per day in 2014 increased 2 percent, mainly reflecting higher gas oil sales. Sales
volumes of refined products were 1.18 million barrels per day in 2013, a decrease of 2 percent from 2012, mainly reflecting
lower gas oil and gasoline sales. U.S. branded gasoline sales of 516,000 barrels per day in 2014 were essentially unchanged
from 2013 and 2012.
Refer to the “Selected Operating Data” table on page 19 for a three-year comparison of sales volumes of gasoline and other
refined products and refinery input volumes.
16 Chevron Corporation 2014 Annual Report