Chevron 2014 Annual Report Download - page 15
Download and view the complete annual report
Please find page 15 of the 2014 Chevron annual report below. You can navigate through the pages in the report by either clicking on the pages listed below, or by using the keyword search tool below to find specific information within the annual report.-
 1
1 -
2
-
3
-
4
-
 5
5 -
 6
6 -
 7
7 -
 8
8 -
 9
9 -
 10
10 -
 11
11 -
 12
12 -
 13
13 -
 14
14 -
 15
15 -
 16
16 -
 17
17 -
 18
18 -
 19
19 -
 20
20 -
 21
21 -
 22
22 -
 23
23 -
 24
24 -
 25
25 -
26
-
27
-
28
-
29
-
30
-
31
-
32
-
33
-
34
-
35
-
36
-
37
-
38
-
39
-
40
-
41
-
42
-
43
-
44
-
45
-
46
-
47
-
48
-
49
-
50
-
51
-
52
-
53
-
54
-
55
-
56
-
57
-
58
-
59
-
60
-
61
-
62
-
63
-
64
-
65
-
66
-
67
-
68
-
69
-
70
-
71
-
72
-
73
-
74
-
75
-
76
-
77
-
78
-
79
-
80
-
81
-
82
-
83
-
84
-
85
-
86
-
87
-
88
 |
 |
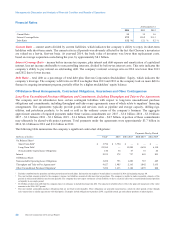
Management’s Discussion and Analysis of Financial Condition and Results of Operations
fields; or other disruptions to operations. The outlook for future production levels is also affected by the size and number of
economic investment opportunities and, for new, large-scale projects, the time lag between initial exploration and the
beginning of production. Investments in upstream projects generally begin well in advance of the start of the associated crude
oil and natural gas production. A significant majority of Chevron’s upstream investment is made outside the United States.
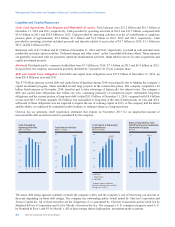
Net proved reserves for consolidated companies and affiliated companies totaled 11.1 billion barrels of oil equivalent at year-
end 2014, a decrease of 1 percent from year-end 2013. The reserve replacement ratio in 2014 was 89 percent. Refer to
Table V beginning on page 74 for a tabulation of the company’s proved net oil and gas reserves by geographic area, at the
beginning of 2012 and each year-end from 2012 through 2014, and an accompanying discussion of major changes to proved
reserves by geographic area for the three-year period ending December 31, 2014.
On November 7, 2011, while drilling a development well in the deepwater Frade Field about 75 miles offshore Brazil, an
unanticipated pressure spike caused oil to migrate from the well bore through a series of fissures to the sea floor, emitting
approximately 2,400 barrels of oil. The source of the seep was substantially contained within four days and the well was
plugged and abandoned. On March 14, 2012, the company identified a small, second seep in a different part of the field. No
evidence of any coastal or wildlife impacts related to either of these seeps have emerged. As reported in the company’s
previously filed periodic reports, it has resolved civil claims relating to these incidents brought by a Brazilian federal district
prosecutor. As also reported previously, the federal district prosecutor also filed criminal charges against Chevron and eleven
Chevron employees. On February 19, 2013, the trial court dismissed the criminal matter, and on appeal, on October 9, 2013,
the appellate court reinstated two of the ten allegations, specifically those charges alleging environmental damage and failure
to provide timely notification to authorities. On February 27, 2014, Chevron filed a motion for reconsideration. While
reconsideration of the motion to dismiss is pending, there will be further proceedings on the reinstated allegations. The
company’s ultimate exposure related to the incident is not currently determinable.
Refer to the “Results of Operations” section on pages 15 through 17 for additional discussion of the company’s upstream
business.
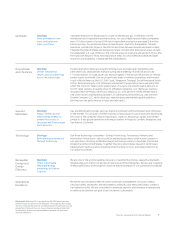
Downstream Earnings for the downstream segment are closely tied to margins on the refining, manufacturing and marketing
of products that include gasoline, diesel, jet fuel, lubricants, fuel oil, fuel and lubricant additives, and petrochemicals.
Industry margins are sometimes volatile and can be affected by the global and regional supply-and-demand balance for
refined products and petrochemicals and by changes in the price of crude oil, other refinery and petrochemical feedstocks,
and natural gas. Industry margins can also be influenced by inventory levels, geopolitical events, costs of materials and
services, refinery or chemical plant capacity utilization, maintenance programs, and disruptions at refineries or chemical
plants resulting from unplanned outages due to severe weather, fires or other operational events.
Other factors affecting profitability for downstream operations include the reliability and efficiency of the company’s
refining, marketing and petrochemical assets, the effectiveness of its crude oil and product supply functions, and the
volatility of tanker-charter rates for the company’s shipping operations, which are driven by the industry’s demand for crude
oil and product tankers. Other factors beyond the company’s control include the general level of inflation and energy costs to
operate the company’s refining, marketing and petrochemical assets.
The company’s most significant marketing areas are the West Coast of North America, the U.S. Gulf Coast, Asia and
southern Africa. Chevron operates or has significant ownership interests in refineries in each of these areas.
Refer to the “Results of Operations” section on pages 15 through 17 for additional discussion of the company’s downstream
operations.
All Other consists of mining activities, power and energy services, worldwide cash management and debt financing
activities, corporate administrative functions, insurance operations, real estate activities, and technology companies.
Chevron Corporation 2014 Annual Report 13