Chevron 2014 Annual Report Download - page 13
Download and view the complete annual report
Please find page 13 of the 2014 Chevron annual report below. You can navigate through the pages in the report by either clicking on the pages listed below, or by using the keyword search tool below to find specific information within the annual report.-
 1
1 -
2
-
 3
3 -
 4
4 -
 5
5 -
 6
6 -
 7
7 -
 8
8 -
 9
9 -
 10
10 -
 11
11 -
 12
12 -
 13
13 -
 14
14 -
 15
15 -
 16
16 -
 17
17 -
 18
18 -
 19
19 -
 20
20 -
 21
21 -
 22
22 -
 23
23 -
24
-
25
-
26
-
27
-
28
-
29
-
30
-
31
-
32
-
33
-
34
-
35
-
36
-
37
-
38
-
39
-
40
-
41
-
42
-
43
-
44
-
45
-
46
-
47
-
48
-
49
-
50
-
51
-
52
-
53
-
54
-
55
-
56
-
57
-
58
-
59
-
60
-
61
-
62
-
63
-
64
-
65
-
66
-
67
-
68
-
69
-
70
-
71
-
72
-
73
-
74
-
75
-
76
-
77
-
78
-
79
-
80
-
81
-
82
-
83
-
84
-
85
-
86
-
87
-
88
 |
 |

Management’s Discussion and Analysis of Financial Condition and Results of Operations
The company closely monitors developments in the financial and credit markets, the level of worldwide economic activity,
and the implications for the company of changes in prices for crude oil and natural gas. Management takes these
developments into account in the conduct of ongoing operations and for business planning.
Comments related to earnings trends for the company’s major business areas are as follows:
Upstream Earnings for the upstream segment are closely aligned with industry prices for crude oil and natural gas. Crude oil
and natural gas prices are subject to external factors over which the company has no control, including product demand
connected with global economic conditions, industry inventory levels, production quotas or other actions imposed by the
Organization of Petroleum Exporting Countries (OPEC), weather-related damage and disruptions, competing fuel prices, and
regional supply interruptions or fears thereof that may be caused by military conflicts, civil unrest or political uncertainty.
Any of these factors could also inhibit the company’s production capacity in an affected region. The company closely
monitors developments in the countries in which it operates and holds investments, and seeks to manage risks in operating its
facilities and businesses. The longer-term trend in earnings for the upstream segment is also a function of other factors,
including the company’s ability to find or acquire and efficiently produce crude oil and natural gas, changes in fiscal terms of
contracts, and changes in tax laws and regulations.
The company continues to actively manage its schedule of work, contracting, procurement and supply-chain activities to
effectively manage costs. However, price levels for capital and exploratory costs and operating expenses associated with the
production of crude oil and natural gas can be subject to external factors beyond the company’s control including, among
other things, the general level of inflation, commodity prices and prices charged by the industry’s material and service
providers, which can be affected by the volatility of the industry’s own supply-and-demand conditions for such materials and
services. In recent years, Chevron and the oil and gas industry generally experienced an increase in certain costs that
exceeded the general trend of inflation in many areas of the world. As a result of the decline in prices of crude oil and other
commodities in 2014, these cost pressures are beginning to soften. Capital and exploratory expenditures and operating
expenses can also be affected by damage to production facilities caused by severe weather or civil unrest.
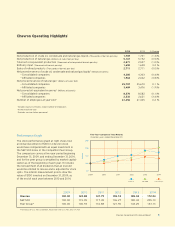
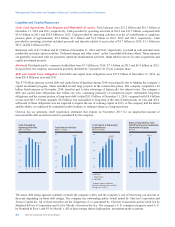
WTI Crude Oil, Brent Crude Oil and Henry Hub Natural Gas Spot Prices — Quarterly Average
0
60
150
120
90
30
0
10
25
20
15
5
1Q 2Q 3Q 4Q 1Q 1Q2Q 2Q3Q 3Q4Q 4Q
WTI/Brent
$/bbl
HH
$/mcf
2012 2013 2014
Brent
WTI
HH
The chart above shows the trend in benchmark prices for Brent crude oil, West Texas Intermediate (WTI) crude oil and U.S.
Henry Hub natural gas. The Brent price averaged $99 per barrel for the full-year 2014, compared to $109 in 2013. As of mid-
February 2015, the Brent price was $60 per barrel. The majority of the company’s equity crude production is priced based on
the Brent benchmark. While geopolitical tensions and supply disruptions supported crude prices through mid-year, crude
prices have since been in decline, as signs of crude oil over-supply emerged during the second half of the year due to
continued robust non-OPEC supply growth, concern over softness in the global economic recovery, and material easing of
geopolitical tensions and supply disruptions. Downward pressure on crude pricing has been further magnified by OPEC’s
decision in November 2014 to maintain the current production ceiling of 30 million barrels per day despite evidence of
market surplus.
The WTI price averaged $93 per barrel for the full-year 2014, compared to $98 in 2013. As of mid-February 2015, the WTI
price was $53 per barrel. WTI traded at a discount to Brent throughout 2014 due to high inventories and excess crude supply
in the U.S. market.
Chevron Corporation 2014 Annual Report 11