Chevron 2014 Annual Report Download - page 73
Download and view the complete annual report
Please find page 73 of the 2014 Chevron annual report below. You can navigate through the pages in the report by either clicking on the pages listed below, or by using the keyword search tool below to find specific information within the annual report.-
 1
1 -
2
-
3
-
4
-
5
-
6
-
7
-
8
-
9
-
10
-
11
-
12
-
13
-
14
-
15
-
16
-
17
-
18
-
19
-
20
-
21
-
22
-
23
-
24
-
25
-
26
-
27
-
28
-
29
-
30
-
31
-
32
-
33
-
34
-
35
-
36
-
37
-
38
-
39
-
40
-
41
-
42
-
43
-
44
-
45
-
46
-
47
-
48
-
49
-
50
-
51
-
52
-
53
-
54
-
55
-
56
-
57
-
58
-
59
-
60
-
61
-
62
-
 63
63 -
 64
64 -
 65
65 -
 66
66 -
 67
67 -
 68
68 -
 69
69 -
 70
70 -
 71
71 -
 72
72 -
 73
73 -
 74
74 -
 75
75 -
 76
76 -
 77
77 -
 78
78 -
 79
79 -
 80
80 -
 81
81 -
 82
82 -
 83
83 -
84
-
85
-
86
-
87
-
88
 |
 |

Supplemental Information on Oil and Gas Producing Activities - Unaudited
reserves and changes in estimated discounted future net cash flows. The amounts for consolidated companies are organized
by geographic areas including the United States, Other Americas, Africa, Asia, Australia/Oceania and Europe. Amounts for
affiliated companies include Chevron’s equity interests in Tengizchevroil (TCO) in the Republic of Kazakhstan and in other
affiliates, principally in Venezuela and Angola. Refer to Note 13, beginning on page 48, for a discussion of the company’s
major equity affiliates.
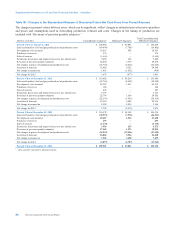
Table II - Capitalized Costs Related to Oil and Gas Producing Activities
Consolidated Companies Affiliated Companies
Millions of dollars U.S.
Other
Americas Africa Asia
Australia/
Oceania Europe Total TCO Other
At December 31, 2014
Unproved properties $ 10,095 $ 3,207 $ 286 $ 1,933 $ 1,990 $ 33 $ 17,544 $ 108 $ —
Proved properties and
related producing assets 75,511 14,697 33,117 47,007 3,303 9,172 182,807 7,370 3,713
Support equipment 1,670 361 1,193 1,791 796 186 5,997 1,331 —
Deferred exploratory wells 1,012 220 647 734 1,330 252 4,195 — —
Other uncompleted projects 7,714 5,566 6,691 5,997 23,487 1,841 51,296 2,679 458
Gross Capitalized Costs 96,002 24,051 41,934 57,462 30,906 11,484 261,839 11,488 4,171
Unproved properties valuation 1,332 796 213 634 46 33 3,054 48 —
Proved producing properties –
Depreciation and depletion 48,315 6,516 19,729 31,207 2,259 7,540 115,566 3,295 845
Support equipment depreciation 711 203 694 1,276 202 159 3,245 611 —
Accumulated provisions 50,358 7,515 20,636 33,117 2,507 7,732 121,865 3,954 845
Net Capitalized Costs $ 45,644 $ 16,536 $ 21,298 $ 24,345 $ 28,399 $ 3,752 $ 139,974 $ 7,534 $ 3,326
At December 31, 2013
Unproved properties $ 10,228 $ 3,697 $ 267 $ 2,064 $ 1,990 $ 36 $ 18,282 $ 109 $ 29
Proved properties and
related producing assets 67,837 12,868 32,936 42,780 3,274 9,592 169,287 6,977 3,408
Support equipment 1,314 344 1,180 1,678 1,608 177 6,301 1,166 —
Deferred exploratory wells 670 297 536 335 1,134 273 3,245 — —
Other uncompleted projects 9,149 4,175 4,424 5,998 16,000 1,390 41,136 1,638 404
Gross Capitalized Costs 89,198 21,381 39,343 52,855 24,006 11,468 238,251 9,890 3,841
Unproved properties valuation 1,243 707 203 389 6 31 2,579 45 10
Proved producing properties –
Depreciation and depletion 45,756 5,695 18,051 27,356 2,083 7,825 106,766 2,672 696
Support equipment depreciation 656 189 647 1,177 384 149 3,202 538 —
Accumulated provisions $ 47,655 $ 6,591 $ 18,901 $ 28,922 $ 2,473 $ 8,005 $ 112,547 $ 3,255 $ 706
Net Capitalized Costs $ 41,543 $ 14,790 $ 20,442 $ 23,933 $ 21,533 $ 3,463 $ 125,704 $ 6,635 $ 3,135
At December 31, 2012
Unproved properties $ 10,478 $ 1,415 $ 271 $ 2,039 $ 1,884 $ 34 $ 16,121 $ 109 $ 28
Proved properties and
related producing assets 62,274 11,237 30,106 39,889 2,420 9,994 155,920 6,832 1,852
Support equipment 1,179 330 1,195 1,554 1,191 172 5,621 1,089 —
Deferred exploratory wells 412 201 598 326 911 233 2,681 — —
Other uncompleted projects 7,203 3,211 3,466 4,123 10,578 768 29,349 906 1,594
Gross Capitalized Costs 81,546 16,394 35,636 47,931 16,984 11,201 209,692 8,936 3,474
Unproved properties valuation 1,121 634 201 253 2 28 2,239 41 —
Proved producing properties –
Depreciation and depletion 42,224 5,288 15,566 24,432 1,832 8,255 97,597 2,274 551
Support equipment depreciation 589 178 613 1,101 305 137 2,923 480 —
Accumulated provisions 43,934 6,100 16,380 25,786 2,139 8,420 102,759 2,795 551
Net Capitalized Costs $ 37,612 $ 10,294 $ 19,256 $ 22,145 $ 14,845 $ 2,781 $ 106,933 $ 6,141 $ 2,923
Chevron Corporation 2014 Annual Report 71