Chevron 2014 Annual Report Download - page 78
Download and view the complete annual report
Please find page 78 of the 2014 Chevron annual report below. You can navigate through the pages in the report by either clicking on the pages listed below, or by using the keyword search tool below to find specific information within the annual report.-
 1
1 -
2
-
3
-
4
-
5
-
6
-
7
-
8
-
9
-
10
-
11
-
12
-
13
-
14
-
15
-
16
-
17
-
18
-
19
-
20
-
21
-
22
-
23
-
24
-
25
-
26
-
27
-
28
-
29
-
30
-
31
-
32
-
33
-
34
-
35
-
36
-
37
-
38
-
39
-
40
-
41
-
42
-
43
-
44
-
45
-
46
-
47
-
48
-
49
-
50
-
51
-
52
-
53
-
54
-
55
-
56
-
57
-
58
-
59
-
60
-
61
-
62
-
63
-
64
-
65
-
66
-
67
-
 68
68 -
 69
69 -
 70
70 -
 71
71 -
 72
72 -
 73
73 -
 74
74 -
 75
75 -
 76
76 -
 77
77 -
 78
78 -
 79
79 -
 80
80 -
 81
81 -
 82
82 -
 83
83 -
 84
84 -
 85
85 -
 86
86 -
 87
87 -
 88
88
 |
 |
Supplemental Information on Oil and Gas Producing Activities - Unaudited
Reserves that remain proved undeveloped for five or more years are a result of several factors that affect optimal project
development and execution, such as the complex nature of the development project in adverse and remote locations, physical
limitations of infrastructure or plant capacities that dictate project timing, compression projects that are pending reservoir
pressure declines, and contractual limitations that dictate production levels.
At year-end 2014, the company held approximately 2.5 billion BOE of proved undeveloped reserves that have remained
undeveloped for five years or more. The majority of these reserves are in three locations where the company has a proven
track record of developing major projects. In Australia, approximately 700 million BOE have remained undeveloped for five
years or more related to the Gorgon Project. The company is currently constructing liquefaction and other facilities in
Australia to develop this natural gas. In Africa, approximately 400 million BOE have remained undeveloped for five years or
more, primarily due to facility constraints at various fields and infrastructure associated with the Escravos gas projects in
Nigeria. Affiliates account for about 1.1 billion BOE of proved undeveloped reserves that have remained undeveloped for
five years or more, with the majority related to the TCO affiliate in Kazakhstan. At TCO, further field development to
convert the remaining proved undeveloped reserves is scheduled to occur in line with reservoir depletion.
Annually, the company assesses whether any changes have occurred in facts or circumstances, such as changes to
development plans, regulations or government policies, that would warrant a revision to reserve estimates. For 2014, this
assessment did not result in any material changes in reserves classified as proved undeveloped. Over the past three years, the
ratio of proved undeveloped reserves to total proved reserves has ranged between 44 percent and 46 percent. The consistent
completion of major capital projects has kept the ratio in a narrow range over this time period.
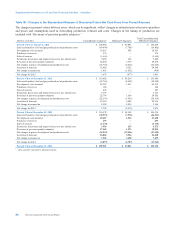
Proved Reserve Quantities For the three years ending December 31, 2014, the pattern of net reserve changes shown in the
following tables are not necessarily indicative of future trends. Apart from acquisitions, the company’s ability to add proved
reserves can be affected by events and circumstances that are outside the company’s control, such as delays in government
permitting, partner approvals of development plans, changes in oil and gas prices, OPEC constraints, geopolitical
uncertainties, and civil unrest.
At December 31, 2014, proved reserves for the company were 11.1 billion BOE. The company’s estimated net proved
reserves of liquids including crude oil, condensate, natural gas liquids and synthetic oil for the years 2012, 2013 and 2014 are
shown in the table on page 77. The company’s estimated net proved reserves of natural gas are shown on page 78.
Noteworthy changes in liquids proved reserves for 2012 through 2014 are discussed below and shown in the table on the
following page:
Revisions In 2012, improved field performance and drilling associated with Gulf of Mexico projects accounted for the
majority of the 104 million barrel increase in the United States. In Asia, drilling results across numerous assets drove the
97 million barrel increase. Improved field performance from various Nigeria and Angola producing assets was primarily
responsible for the 66 million barrel increase in Africa. Improved plant efficiency for the TCO affiliate was responsible for a
large portion of the 59 million barrel increase.
In 2013, improved field performance from various Nigeria and Angola producing assets was primarily responsible for the
94 million barrel increase in Africa. In Asia, drilling performance across numerous assets resulted in an 84 million barrel
increase. Improved field performance and drilling associated with Gulf of Mexico projects and drilling in the Midland and
Delaware basins accounted for the majority of the 55 million barrel increase in the United States. Synthetic oil reserves in
Canada increased by 40 million barrels, primarily due to improved field performance.
In 2014, drilling in the Midland and Delaware basins and improved field performance and drilling in California accounted for
the majority of the 90 million barrel increase in the United States. Improved field performance at various Nigeria fields was
primarily responsible for the 74 million barrel increase in Africa. In Asia, drilling performance across numerous assets,
primarily in Indonesia, resulted in the 80 million barrel increase.
Improved Recovery In 2012, improved recovery increased reserves by 77 million barrels, primarily due to secondary
recovery performance in Africa and in Gulf of Mexico fields in the United States.
In 2013, improved recovery increased reserves by 57 million barrels due to numerous small projects, including expansions of
existing projects in the United States, Europe, Asia, and Africa.
In 2014, improved recovery increased reserves by 34 million barrels, primarily due to secondary recovery projects in the
United States, mostly related to steamflood expansions in California.
76 Chevron Corporation 2014 Annual Report