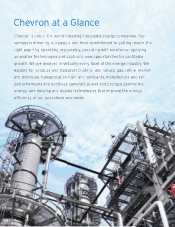
Chevron 2014 Annual Report Download - page 12
Download and view the complete annual report
Please find page 12 of the 2014 Chevron annual report below. You can navigate through the pages in the report by either clicking on the pages listed below, or by using the keyword search tool below to find specific information within the annual report.-
 1
1 -
 2
2 -
 3
3 -
 4
4 -
 5
5 -
 6
6 -
 7
7 -
 8
8 -
 9
9 -
 10
10 -
 11
11 -
 12
12 -
 13
13 -
 14
14 -
 15
15 -
 16
16 -
 17
17 -
 18
18 -
 19
19 -
 20
20 -
 21
21 -
 22
22 -
23
-
24
-
25
-
26
-
27
-
28
-
29
-
30
-
31
-
32
-
33
-
34
-
35
-
36
-
37
-
38
-
39
-
40
-
41
-
42
-
43
-
44
-
45
-
46
-
47
-
48
-
49
-
50
-
51
-
52
-
53
-
54
-
55
-
56
-
57
-
58
-
59
-
60
-
61
-
62
-
63
-
64
-
65
-
66
-
67
-
68
-
69
-
70
-
71
-
72
-
73
-
74
-
75
-
76
-
77
-
78
-
79
-
80
-
81
-
82
-
83
-
84
-
85
-
86
-
87
-
88
 |
 |

Management’s Discussion and Analysis of Financial Condition and Results of Operations
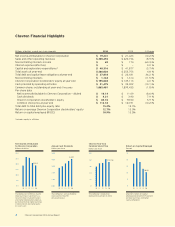
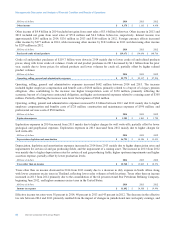
Key Financial Results
Millions of dollars, except per-share amounts 2014 2013 2012
Net Income Attributable to Chevron Corporation $ 19,241 $ 21,423 $ 26,179
Per Share Amounts:
Net Income Attributable to Chevron Corporation
– Basic $ 10.21 $ 11.18 $ 13.42
– Diluted $ 10.14 $ 11.09 $ 13.32
Dividends $ 4.21 $ 3.90 $ 3.51
Sales and Other Operating Revenues $ 200,494 $ 220,156 $ 230,590
Return on:
Capital Employed 10.9% 13.5% 18.7%
Stockholders’ Equity 12.7% 15.0% 20.3%
Earnings by Major Operating Area
Millions of dollars 2014 2013 2012
Upstream
United States $ 3,327 $ 4,044 $ 5,332
International 13,566 16,765 18,456
Total Upstream 16,893 20,809 23,788
Downstream
United States 2,637 787 2,048
International 1,699 1,450 2,251
Total Downstream 4,336 2,237 4,299
All Other (1,988) (1,623) (1,908)
Net Income Attributable to Chevron Corporation1,2 $ 19,241 $ 21,423 $ 26,179
1Includes foreign currency effects: $ 487 $ 474 $ (454)
2Income net of tax, also referred to as “earnings” in the discussions that follow.
Refer to the “Results of Operations” section beginning on page 15 for a discussion of financial results by major operating
area for the three years ended December 31, 2014.
Business Environment and Outlook
Chevron is a global energy company with substantial business activities in the following countries: Angola, Argentina,
Australia, Azerbaijan, Bangladesh, Brazil, Canada, China, Colombia, Democratic Republic of the Congo, Denmark,
Indonesia, Kazakhstan, Myanmar, Nigeria, the Partitioned Zone between Saudi Arabia and Kuwait, the Philippines, Republic
of the Congo, Singapore, South Africa, South Korea, Thailand, Trinidad and Tobago, the United Kingdom, the United States,
Venezuela, and Vietnam.
Earnings of the company depend mostly on the profitability of its upstream business segment. The biggest factor affecting
the results of operations for the upstream segment is the price of crude oil. The price of crude oil has fallen significantly
since mid-year 2014, reflecting robust non-OPEC supply growth led by expanding unconventional production in the United
States, weakening growth in emerging markets, and the decision by OPEC in fourth quarter 2014 to maintain its current
production ceiling. The downturn in the price of crude oil has impacted, and, depending upon its duration, will continue to
significantly impact the company’s results of operations, cash flows, capital and exploratory investment program and
production outlook. If lower prices persist for an extended period of time, the company’s response could include further
reductions in operating expenses and capital and exploratory expenditures and additional asset sales. The company
anticipates that crude oil prices will increase in the future, as continued growth in demand and a slowing in supply growth
should bring global markets into balance; however, the timing of any such increases is unknown. In the company’s
downstream business, crude oil is the largest cost component of refined products.
Refer to the “Cautionary Statement Relevant to Forward-Looking Information” on page 9 and to “Risk Factors” in Part I,
Item 1A, on pages 22 through 24 on the company’s Annual Report on Form 10-K for a discussion of some of the inherent
risks that could materially impact the company’s results of operations or financial condition.
The company continually evaluates opportunities to dispose of assets that are not expected to provide sufficient long-term
value or to acquire assets or operations complementary to its asset base to help augment the company’s financial
performance and growth. Refer to the “Results of Operations” section beginning on page 15 for discussions of net gains on
asset sales during 2014. Asset dispositions and restructurings may also occur in future periods and could result in significant
gains or losses.
10 Chevron Corporation 2014 Annual Report