Chevron 2014 Annual Report Download - page 49
Download and view the complete annual report
Please find page 49 of the 2014 Chevron annual report below. You can navigate through the pages in the report by either clicking on the pages listed below, or by using the keyword search tool below to find specific information within the annual report.-
 1
1 -
2
-
3
-
4
-
5
-
6
-
7
-
8
-
9
-
10
-
11
-
12
-
13
-
14
-
15
-
16
-
17
-
18
-
19
-
20
-
21
-
22
-
23
-
24
-
25
-
26
-
27
-
28
-
29
-
30
-
31
-
32
-
33
-
34
-
35
-
36
-
37
-
38
-
 39
39 -
 40
40 -
 41
41 -
 42
42 -
 43
43 -
 44
44 -
 45
45 -
 46
46 -
 47
47 -
 48
48 -
 49
49 -
 50
50 -
 51
51 -
 52
52 -
 53
53 -
 54
54 -
 55
55 -
 56
56 -
 57
57 -
 58
58 -
 59
59 -
60
-
61
-
62
-
63
-
64
-
65
-
66
-
67
-
68
-
69
-
70
-
71
-
72
-
73
-
74
-
75
-
76
-
77
-
78
-
79
-
80
-
81
-
82
-
83
-
84
-
85
-
86
-
87
-
88
 |
 |

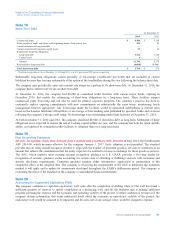
Notes to the Consolidated Financial Statements
Millions of dollars, except per-share amounts
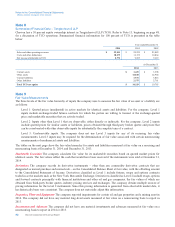
from crude oil. This segment also generates revenues from the manufacture and sale of fuel and lubricant additives and the
transportation and trading of refined products and crude oil. “All Other” activities include revenues from power and energy
services, insurance operations, real estate activities and technology companies.
Year ended December 31
2014 2013 2012
Upstream
United States $ 7,455 $ 8,052 $ 6,416
Intersegment 15,455 16,865 17,229
Total United States 22,910 24,917 23,645
International 23,808 17,607 19,459
Intersegment 23,107 33,034 34,094
Total International 46,915 50,641 53,553
Total Upstream*69,825 75,558 77,198
Downstream
United States 73,942 80,272 83,043
Excise and similar taxes 4,633 4,792 4,665
Intersegment 31 39 49
Total United States 78,606 85,103 87,757
International 86,848 105,373 113,279
Excise and similar taxes 3,553 3,699 3,346
Intersegment 8,839 859 80
Total International 99,240 109,931 116,705
Total Downstream*177,846 195,034 204,462
All Other
United States 252 358 378
Intersegment 1,475 1,524 1,300
Total United States 1,727 1,882 1,678
International 334
Intersegment 28 31 48
Total International 31 34 52
Total All Other 1,758 1,916 1,730
Segment Sales and Other Operating Revenues
United States 103,243 111,902 113,080
International 146,186 160,606 170,310
Total Segment Sales and Other Operating Revenues 249,429 272,508 283,390
Elimination of intersegment sales (48,935) (52,352) (52,800)
Total Sales and Other Operating Revenues $ 200,494 $ 220,156 $ 230,590
*Effective January 1, 2014, International Upstream prospectively includes selected amounts previously recognized in International Downstream, which are not material to the
company’s results of operations or financial position.
Segment Income Taxes Segment income tax expense for the years 2014, 2013 and 2012 is as follows:
Year ended December 31
2014 2013 2012
Upstream
United States $ 2,043 $ 2,333 $ 2,820
International 9,217 12,470 16,554
Total Upstream 11,260 14,803 19,374
Downstream
United States 1,302 364 1,051
International 467 389 587
Total Downstream 1,769 753 1,638
All Other (1,137) (1,248) (1,016)
Total Income Tax Expense $ 11,892 $ 14,308 $ 19,996
Other Segment Information Additional information for the segmentation of major equity affiliates is contained in Note 13.
Information related to properties, plant and equipment by segment is contained in Note 14, on page 49.
Chevron Corporation 2014 Annual Report 47