Chevron 2014 Annual Report Download - page 48
Download and view the complete annual report
Please find page 48 of the 2014 Chevron annual report below. You can navigate through the pages in the report by either clicking on the pages listed below, or by using the keyword search tool below to find specific information within the annual report.-
 1
1 -
2
-
3
-
4
-
5
-
6
-
7
-
8
-
9
-
10
-
11
-
12
-
13
-
14
-
15
-
16
-
17
-
18
-
19
-
20
-
21
-
22
-
23
-
24
-
25
-
26
-
27
-
28
-
29
-
30
-
31
-
32
-
33
-
34
-
35
-
36
-
37
-
 38
38 -
 39
39 -
 40
40 -
 41
41 -
 42
42 -
 43
43 -
 44
44 -
 45
45 -
 46
46 -
 47
47 -
 48
48 -
 49
49 -
 50
50 -
 51
51 -
 52
52 -
 53
53 -
 54
54 -
 55
55 -
 56
56 -
 57
57 -
 58
58 -
59
-
60
-
61
-
62
-
63
-
64
-
65
-
66
-
67
-
68
-
69
-
70
-
71
-
72
-
73
-
74
-
75
-
76
-
77
-
78
-
79
-
80
-
81
-
82
-
83
-
84
-
85
-
86
-
87
-
88
 |
 |

Notes to the Consolidated Financial Statements
Millions of dollars, except per-share amounts
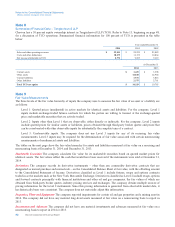
Segment Earnings The company evaluates the performance of its operating segments on an after-tax basis, without
considering the effects of debt financing interest expense or investment interest income, both of which are managed by the
company on a worldwide basis. Corporate administrative costs and assets are not allocated to the operating segments.
However, operating segments are billed for the direct use of corporate services. Nonbillable costs remain at the corporate
level in “All Other.” Earnings by major operating area are presented in the following table:
Year ended December 31
2014 2013 2012
Segment Earnings
Upstream
United States $ 3,327 $ 4,044 $ 5,332
International 13,566 16,765 18,456
Total Upstream 16,893 20,809 23,788
Downstream
United States 2,637 787 2,048
International 1,699 1,450 2,251
Total Downstream 4,336 2,237 4,299
Total Segment Earnings 21,229 23,046 28,087
All Other
Interest income 77 80 83
Other (2,065) (1,703) (1,991)
Net Income Attributable to Chevron Corporation $ 19,241 $ 21,423 $ 26,179
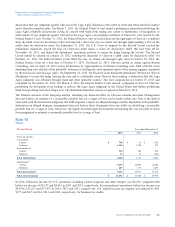
Segment Assets Segment assets do not include intercompany investments or receivables. Assets at year-end 2014 and 2013
are as follows:
At December 31
2014 2013
Upstream
United States $ 49,205 $ 45,436
International 152,736 137,096
Goodwill 4,593 4,639
Total Upstream 206,534 187,171
Downstream
United States 23,068 23,829
International 17,723 20,268
Total Downstream 40,791 44,097
Total Segment Assets 247,325 231,268
All Other
United States 6,741 7,326
International 11,960 15,159
Total All Other 18,701 22,485
Total Assets – United States 79,014 76,591
Total Assets – International 182,419 172,523
Goodwill 4,593 4,639
Total Assets $ 266,026 $ 253,753
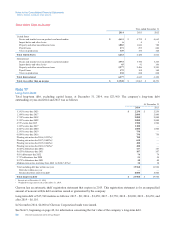
Segment Sales and Other Operating Revenues Operating segment sales and other operating revenues, including internal
transfers, for the years 2014, 2013 and 2012, are presented in the table that follows. Products are transferred between
operating segments at internal product values that approximate market prices.
Revenues for the upstream segment are derived primarily from the production and sale of crude oil and natural gas, as well as
the sale of third-party production of natural gas. Revenues for the downstream segment are derived from the refining and
marketing of petroleum products such as gasoline, jet fuel, gas oils, lubricants, residual fuel oils and other products derived
46 Chevron Corporation 2014 Annual Report