Chevron 2014 Annual Report Download - page 51
Download and view the complete annual report
Please find page 51 of the 2014 Chevron annual report below. You can navigate through the pages in the report by either clicking on the pages listed below, or by using the keyword search tool below to find specific information within the annual report.-
 1
1 -
2
-
3
-
4
-
5
-
6
-
7
-
8
-
9
-
10
-
11
-
12
-
13
-
14
-
15
-
16
-
17
-
18
-
19
-
20
-
21
-
22
-
23
-
24
-
25
-
26
-
27
-
28
-
29
-
30
-
31
-
32
-
33
-
34
-
35
-
36
-
37
-
38
-
39
-
40
-
 41
41 -
 42
42 -
 43
43 -
 44
44 -
 45
45 -
 46
46 -
 47
47 -
 48
48 -
 49
49 -
 50
50 -
 51
51 -
 52
52 -
 53
53 -
 54
54 -
 55
55 -
 56
56 -
 57
57 -
 58
58 -
 59
59 -
 60
60 -
 61
61 -
62
-
63
-
64
-
65
-
66
-
67
-
68
-
69
-
70
-
71
-
72
-
73
-
74
-
75
-
76
-
77
-
78
-
79
-
80
-
81
-
82
-
83
-
84
-
85
-
86
-
87
-
88
 |
 |

Notes to the Consolidated Financial Statements
Millions of dollars, except per-share amounts
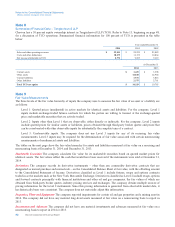
GS Caltex Corporation Chevron owns 50 percent of GS Caltex Corporation, a joint venture with GS Energy. The joint
venture imports, refines and markets petroleum products, petrochemicals and lubricants, predominantly in South Korea.
Chevron Phillips Chemical Company LLC Chevron owns 50 percent of Chevron Phillips Chemical Company LLC. The
other half is owned by Phillips 66.
Caltex Australia Ltd. Chevron has a 50 percent equity ownership interest in Caltex Australia Ltd. (CAL). The remaining 50
percent of CAL is publicly owned. At December 31, 2014, the fair value of Chevron’s share of CAL common stock was
approximately $3,755.
Other Information “Sales and other operating revenues” on the Consolidated Statement of Income includes $10,404,
$14,635 and $17,356 with affiliated companies for 2014, 2013 and 2012, respectively. “Purchased crude oil and products”
includes $6,735, $7,063 and $6,634 with affiliated companies for 2014, 2013 and 2012, respectively.
“Accounts and notes receivable” on the Consolidated Balance Sheet includes $924 and $1,328 due from affiliated companies
at December 31, 2014 and 2013, respectively. “Accounts payable” includes $345 and $466 due to affiliated companies at
December 31, 2014 and 2013, respectively.
The following table provides summarized financial information on a 100 percent basis for all equity affiliates as well as
Chevron’s total share, which includes Chevron’s net loans to affiliates of $874, $1,129 and $1,494 at December 31, 2014,
2013 and 2012, respectively.
Affiliates Chevron Share
Year ended December 31 2014 2013 2012 2014 2013 2012
Total revenues $ 123,003 $ 131,875 $ 136,065 $ 58,937 $ 63,101 $ 65,196
Income before income tax expense 20,609 24,075 23,016 9,968 11,108 9,856
Net income attributable to affiliates 14,758 15,594 16,786 7,237 7,845 6,938
At December 31
Current assets $ 35,662 $ 39,713 $ 37,541 $ 13,465 $ 15,156 $ 14,732
Noncurrent assets 70,817 68,593 66,065 26,053 25,059 23,523
Current liabilities 25,308 29,642 27,878 9,588 11,587 11,093
Noncurrent liabilities 17,983 19,442 19,366 4,211 4,559 4,879
Total affiliates’ net equity $ 63,188 $ 59,222 $ 56,362 $ 25,719 $ 24,069 $ 22,283
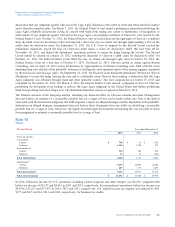
Note 14
Properties, Plant and Equipment1
At December 31 Year ended December 31
Gross Investment at Cost Net Investment Additions at Cost2Depreciation Expense3
2014 2013 2012 2014 2013 2012 2014 2013 2012 2014 2013 2012
Upstream
United States $ 96,850 $ 89,555 $ 81,908 $ 45,864 $ 41,831 $ 37,909 $ 9,688 $ 8,188 $ 8,211 $ 5,127 $ 4,412 $ 3,902
International 192,637 169,623 145,799 118,926 104,100 85,318 24,920 27,383 21,343 9,688 8,336 8,015
Total Upstream 289,487 259,178 227,707 164,790 145,931 123,227 34,608 35,571 29,554 14,815 12,748 11,917
Downstream
United States 22,640 22,407 21,792 11,019 11,481 11,333 588 1,154 1,498 886 780 799
International 9,334 9,303 8,990 4,219 4,139 3,930 530 653 2,544 396 360 308
Total Downstream 31,974 31,710 30,782 15,238 15,620 15,263 1,118 1,807 4,042 1,282 1,140 1,107
All Other
United States 5,673 5,402 4,959 3,077 3,194 2,845 581 721 415 680 286 384
International 155 143 33 68 84 13 25 23 4 16 12 5
Total All Other 5,828 5,545 4,992 3,145 3,278 2,858 606 744 419 696 298 389
Total United States 125,163 117,364 108,659 59,960 56,506 52,087 10,857 10,063 10,124 6,693 5,478 5,085
Total International 202,126 179,069 154,822 123,213 108,323 89,261 25,475 28,059 23,891 10,100 8,708 8,328
Total $ 327,289 $ 296,433 $ 263,481 $ 183,173 $ 164,829 $ 141,348 $ 36,332 $ 38,122 $ 34,015 $ 16,793 $ 14,186 $ 13,413
1Other than the United States, Australia and Nigeria, no other country accounted for 10 percent or more of the company’s net properties, plant and equipment (PP&E) in 2014.
Australia had $41,012, $31,464 and $21,770 in 2014, 2013, and 2012, respectively. Nigeria had PP&E of $19,214, $18,429 and $17,485 for 2014, 2013 and 2012, respectively.
2Net of dry hole expense related to prior years’ expenditures of $371, $89 and $80 in 2014, 2013 and 2012, respectively.
3Depreciation expense includes accretion expense of $882, $627 and $629 in 2014, 2013 and 2012, respectively.
Chevron Corporation 2014 Annual Report 49