Chevron 2014 Annual Report Download - page 46
Download and view the complete annual report
Please find page 46 of the 2014 Chevron annual report below. You can navigate through the pages in the report by either clicking on the pages listed below, or by using the keyword search tool below to find specific information within the annual report.-
 1
1 -
2
-
3
-
4
-
5
-
6
-
7
-
8
-
9
-
10
-
11
-
12
-
13
-
14
-
15
-
16
-
17
-
18
-
19
-
20
-
21
-
22
-
23
-
24
-
25
-
26
-
27
-
28
-
29
-
30
-
31
-
32
-
33
-
34
-
35
-
 36
36 -
 37
37 -
 38
38 -
 39
39 -
 40
40 -
 41
41 -
 42
42 -
 43
43 -
 44
44 -
 45
45 -
 46
46 -
 47
47 -
 48
48 -
 49
49 -
 50
50 -
 51
51 -
 52
52 -
 53
53 -
 54
54 -
 55
55 -
 56
56 -
57
-
58
-
59
-
60
-
61
-
62
-
63
-
64
-
65
-
66
-
67
-
68
-
69
-
70
-
71
-
72
-
73
-
74
-
75
-
76
-
77
-
78
-
79
-
80
-
81
-
82
-
83
-
84
-
85
-
86
-
87
-
88
 |
 |

Notes to the Consolidated Financial Statements
Millions of dollars, except per-share amounts
The company uses derivative commodity instruments traded on the New York Mercantile Exchange and on electronic
platforms of the Inter-Continental Exchange and Chicago Mercantile Exchange. In addition, the company enters into swap
contracts and option contracts principally with major financial institutions and other oil and gas companies in the “over-the-
counter” markets, which are governed by International Swaps and Derivatives Association agreements and other master
netting arrangements. Depending on the nature of the derivative transactions, bilateral collateral arrangements may also be
required.
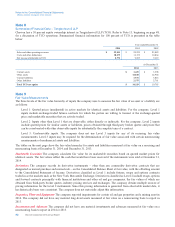
Derivative instruments measured at fair value at December 31, 2014, December 31, 2013, and December 31, 2012, and their
classification on the Consolidated Balance Sheet and Consolidated Statement of Income are as follows:
Consolidated Balance Sheet: Fair Value of Derivatives Not Designated as Hedging Instruments
At December 31
Type of Contract Balance Sheet Classification 2014 2013
Commodity Accounts and notes receivable, net $ 401 $22
Commodity Long-term receivables, net 12 6
Total Assets at Fair Value $ 413 $28
Commodity Accounts payable $57$65
Commodity Deferred credits and other noncurrent obligations 27 24
Total Liabilities at Fair Value $84$89
Consolidated Statement of Income: The Effect of Derivatives Not Designated as Hedging Instruments
Gain/(Loss)
Type of Derivative Statement of Year ended December 31
Contract Income Classification 2014 2013 2012
Commodity Sales and other operating revenues $ 553 $ (108) $ (49)
Commodity Purchased crude oil and products (17) (77) (24)
Commodity Other income (32) (9) 6
$ 504 $ (194) $ (67)
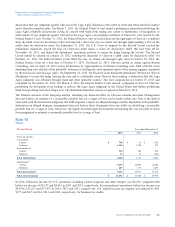
The table below represents gross and net derivative assets and liabilities subject to netting agreements on the Consolidated
Balance Sheet at December 31, 2014 and December 31, 2013.
Consolidated Balance Sheet: The Effect of Netting Derivative Assets and Liabilities
At December 31, 2014
Gross Amount
Recognized
Gross Amounts
Offset
Net Amounts
Presented
Gross Amounts
Not Offset Net Amount
Derivative Assets $ 4,004 $ 3,591 $ 413 $ 7 $ 406
Derivative Liabilities $ 3,675 $ 3,591 $ 84 $ — $ 84
At December 31, 2013
Derivative Assets $ 732 $ 704 $ 28 $ 27 $ 1
Derivative Liabilities $ 793 $ 704 $ 89 $ — $ 89
Derivative assets and liabilities are classified on the Consolidated Balance Sheet as accounts and notes receivable, long-term
receivables, accounts payable, and deferred credits and other noncurrent obligations. Amounts not offset on the Consolidated
Balance Sheet represent positions that do not meet all the conditions for “a right of offset.”
Concentrations of Credit Risk The company’s financial instruments that are exposed to concentrations of credit risk consist
primarily of its cash equivalents, time deposits, marketable securities, derivative financial instruments and trade receivables.
The company’s short-term investments are placed with a wide array of financial institutions with high credit ratings.
Company investment policies limit the company’s exposure both to credit risk and to concentrations of credit risk. Similar
policies on diversification and creditworthiness are applied to the company’s counterparties in derivative instruments.
The trade receivable balances, reflecting the company’s diversified sources of revenue, are dispersed among the company’s
broad customer base worldwide. As a result, the company believes concentrations of credit risk are limited. The company
routinely assesses the financial strength of its customers. When the financial strength of a customer is not considered
sufficient, alternative risk mitigation measures may be deployed, including requiring pre-payments, letters of credit or other
acceptable collateral instruments to support sales to customers.
44 Chevron Corporation 2014 Annual Report