Chevron 2014 Annual Report Download - page 17
Download and view the complete annual report
Please find page 17 of the 2014 Chevron annual report below. You can navigate through the pages in the report by either clicking on the pages listed below, or by using the keyword search tool below to find specific information within the annual report.-
 1
1 -
2
-
3
-
4
-
5
-
6
-
 7
7 -
 8
8 -
 9
9 -
 10
10 -
 11
11 -
 12
12 -
 13
13 -
 14
14 -
 15
15 -
 16
16 -
 17
17 -
 18
18 -
 19
19 -
 20
20 -
 21
21 -
 22
22 -
 23
23 -
 24
24 -
 25
25 -
 26
26 -
 27
27 -
28
-
29
-
30
-
31
-
32
-
33
-
34
-
35
-
36
-
37
-
38
-
39
-
40
-
41
-
42
-
43
-
44
-
45
-
46
-
47
-
48
-
49
-
50
-
51
-
52
-
53
-
54
-
55
-
56
-
57
-
58
-
59
-
60
-
61
-
62
-
63
-
64
-
65
-
66
-
67
-
68
-
69
-
70
-
71
-
72
-
73
-
74
-
75
-
76
-
77
-
78
-
79
-
80
-
81
-
82
-
83
-
84
-
85
-
86
-
87
-
88
 |
 |

Management’s Discussion and Analysis of Financial Condition and Results of Operations
Results of Operations
The following section presents the results of operations and variances on an after-tax basis for the company’s business
segments – Upstream and Downstream – as well as for “All Other.” Earnings are also presented for the U.S. and international
geographic areas of the Upstream and Downstream business segments. Refer to Note 12, beginning on page 45, for a
discussion of the company’s “reportable segments.” This section should also be read in conjunction with the discussion in
“Business Environment and Outlook” on pages 10 through 13.
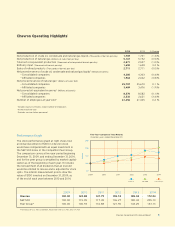
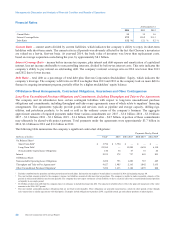
0
2500
2000
1500
1000
500
Exploration Expenses
Millions of dollars
1110 12 13 14
$1,985
0.0
28.0
14.0
21.0
7.0
Worldwide Upstream Earnings
Billions of dollars
United States
International
1110 12 13 14
$16.9
0.0
4.4
3.3
1.1
2.2
Worldwide Downstream
Earnings*
Billions of dollars
$4.3
1110 12 13 14
0
3600
2700
1800
900
Worldwide Gasoline & Other
Refined Product Sales
Thousands of barrels per day
United States
International
United States
International
*Includes equity in affiliates.
Gasoline
Jet Fuel
Gas Oils
Residual Fuel Oil
Other
2,711
1110 12 13 14
U.S. Upstream
Millions of dollars 2014 2013 2012
Earnings $ 3,327 $ 4,044 $ 5,332
U.S. upstream earnings of $3.3 billion in 2014 decreased $717 million from 2013, primarily due to lower crude oil prices of
$950 million. Higher depreciation expenses of $440 million and higher operating expenses of $210 million also contributed
to the decline. Partially offsetting the decrease were higher gains on asset sales of $700 million in the current period
compared with $60 million in 2013, higher natural gas realizations of $150 million and higher crude oil production of $100
million.
U.S. upstream earnings of $4.0 billion in 2013 decreased $1.3 billion from 2012, primarily due to higher operating,
depreciation and exploration expenses of $420 million, $350 million, and $190 million, respectively, and lower crude oil
production of $170 million. Higher natural gas realizations of approximately $200 million were mostly offset by lower crude
oil realizations of $170 million.
The company’s average realization for U.S. crude oil and natural gas liquids in 2014 was $84.13 per barrel, compared with
$93.46 in 2013 and $95.21 in 2012. The average natural gas realization was $3.90 per thousand cubic feet in 2014, compared
with $3.37 and $2.64 in 2013 and 2012, respectively.
Net oil-equivalent production in 2014 averaged 664,000 barrels per day, up 1 percent from both 2013 and 2012. Between
2014 and 2013, production increases in the Permian Basin in Texas and New Mexico and the Marcellus Shale in western
Pennsylvania were partially offset by normal field declines. Between 2013 and 2012, new production in the Marcellus Shale
in western Pennsylvania and the Delaware Basin in New Mexico, along with the absence of weather-related downtime in the
Gulf of Mexico, was largely offset by normal field declines.
The net liquids component of oil-equivalent production for 2014 averaged 456,000 barrels per day, up 2 percent from 2013
and largely unchanged from 2012. Net natural gas production averaged about 1.3 billion cubic feet per day in 2014, largely
unchanged from 2013 and up 4 percent from 2012. Refer to the “Selected Operating Data” table on page 19 for a three-year
comparative of production volumes in the United States.
Chevron Corporation 2014 Annual Report 15