Chevron 2014 Annual Report Download - page 19
Download and view the complete annual report
Please find page 19 of the 2014 Chevron annual report below. You can navigate through the pages in the report by either clicking on the pages listed below, or by using the keyword search tool below to find specific information within the annual report.-
 1
1 -
2
-
3
-
4
-
5
-
6
-
7
-
8
-
 9
9 -
 10
10 -
 11
11 -
 12
12 -
 13
13 -
 14
14 -
 15
15 -
 16
16 -
 17
17 -
 18
18 -
 19
19 -
 20
20 -
 21
21 -
 22
22 -
 23
23 -
 24
24 -
 25
25 -
 26
26 -
 27
27 -
 28
28 -
 29
29 -
30
-
31
-
32
-
33
-
34
-
35
-
36
-
37
-
38
-
39
-
40
-
41
-
42
-
43
-
44
-
45
-
46
-
47
-
48
-
49
-
50
-
51
-
52
-
53
-
54
-
55
-
56
-
57
-
58
-
59
-
60
-
61
-
62
-
63
-
64
-
65
-
66
-
67
-
68
-
69
-
70
-
71
-
72
-
73
-
74
-
75
-
76
-
77
-
78
-
79
-
80
-
81
-
82
-
83
-
84
-
85
-
86
-
87
-
88
 |
 |

Management’s Discussion and Analysis of Financial Condition and Results of Operations
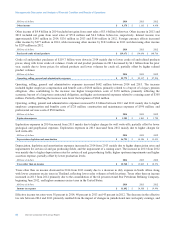
International Downstream
Millions of dollars 2014 2013 2012
Earnings*$ 1,699 $ 1,450 $ 2,251
*Includes foreign currency effects: $ (112) $ (76) $ (173)
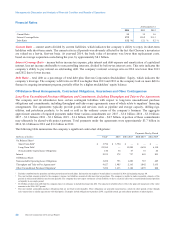
International downstream earned $1.7 billion in 2014, compared with $1.5 billion in 2013. The increase was mainly due to a
favorable change in the effects on derivative instruments of $640 million. The increase was partially offset by the economic
buyout of a legacy pension obligation of $160 million in the current period, lower margins on refined product sales of $130
million and higher tax expenses of $110 million. Foreign currency effects decreased earnings by $112 million in 2014,
compared to a decrease of $76 million a year earlier.
International downstream earned $1.5 billion in 2013, compared with $2.3 billion in 2012. Earnings decreased due to lower
gains on asset sales of $540 million and higher income tax expenses of $110 million. Foreign currency effects decreased
earnings by $76 million in 2013, compared with a decrease of $173 million a year earlier.
Total refined product sales of 1.50 million barrels per day in 2014 declined 2 percent from 2013, mainly reflecting lower gas
oil sales. Sales of 1.53 million barrels per day in 2013 declined 2 percent from 2012, mainly reflecting lower fuel oil and
gasoline sales.
Refer to the “Selected Operating Data” table, on page 19, for a three-year comparison of sales volumes of gasoline and other
refined products and refinery input volumes.
All Other
Millions of dollars 2014 2013 2012
Net charges*$ (1,988) $ (1,623) $ (1,908)
*Includes foreign currency effects: $2$ (9) $ (6)
All Other consists of mining activities, power and energy services, worldwide cash management and debt financing
activities, corporate administrative functions, insurance operations, real estate activities, and technology companies.
Net charges in 2014 increased $365 million from 2013, mainly due to environmental reserves additions, asset impairments
and additional asset retirement obligations for mining assets, as well as higher corporate tax items. These increases were
partially offset by the absence of 2013 impairments of power-related affiliates and lower other corporate charges. Net
charges in 2013 decreased $285 million from 2012, mainly due to lower corporate tax items and other corporate charges.
Consolidated Statement of Income
Comparative amounts for certain income statement categories are shown below:
Millions of dollars 2014 2013 2012
Sales and other operating revenues $ 200,494 $ 220,156 $ 230,590
Sales and other operating revenues decreased in 2014 primarily due to lower crude oil volumes, and lower refined product
and crude oil prices. The decrease between 2013 and 2012 was mainly due to lower refined product prices and lower crude
oil volumes and prices.
Millions of dollars 2014 2013 2012
Income from equity affiliates $ 7,098 $ 7,527 $ 6,889
Income from equity affiliates decreased in 2014 from 2013 mainly due to lower upstream-related earnings from
Tengizchevroil in Kazakhstan, Petropiar and Petroboscan in Venezuela, and Angola LNG. Partially offsetting these effects
were higher downstream-related earnings from GS Caltex in South Korea, higher earnings from CPChem and the absence of
2013 impairments of power-related affiliates.
Income from equity affiliates increased in 2013 from 2012 mainly due to higher upstream-related earnings from
Tengizchevroil in Kazakhstan and Petropiar in Venezuela, and higher earnings from CPChem, partially offset by 2013
impairments of power-related affiliates.
Refer to Note 13, beginning on page 48, for a discussion of Chevron’s investments in affiliated companies.
Chevron Corporation 2014 Annual Report 17