Boeing 2014 Annual Report Download - page 63
Download and view the complete annual report
Please find page 63 of the 2014 Boeing annual report below. You can navigate through the pages in the report by either clicking on the pages listed below, or by using the keyword search tool below to find specific information within the annual report.-
 1
1 -
2
-
3
-
4
-
5
-
6
-
7
-
8
-
9
-
10
-
11
-
12
-
13
-
14
-
15
-
16
-
17
-
18
-
19
-
20
-
21
-
22
-
23
-
24
-
25
-
26
-
27
-
28
-
29
-
30
-
31
-
32
-
33
-
34
-
35
-
36
-
37
-
38
-
39
-
40
-
41
-
42
-
43
-
44
-
45
-
46
-
47
-
48
-
49
-
50
-
51
-
52
-
 53
53 -
 54
54 -
 55
55 -
 56
56 -
 57
57 -
 58
58 -
 59
59 -
 60
60 -
 61
61 -
 62
62 -
 63
63 -
 64
64 -
 65
65 -
 66
66 -
 67
67 -
 68
68 -
 69
69 -
 70
70 -
 71
71 -
 72
72 -
 73
73 -
74
-
75
-
76
-
77
-
78
-
79
-
80
-
81
-
82
-
83
-
84
-
85
-
86
-
87
-
88
-
89
-
90
-
91
-
92
-
93
-
94
-
95
-
96
-
97
-
98
-
99
-
100
-
101
-
102
-
103
-
104
-
105
-
106
-
107
-
108
-
109
-
110
-
111
-
112
-
113
-
114
-
115
-
116
-
117
-
118
-
119
-
120
-
121
-
122
-
123
-
124
-
125
-
126
-
127
-
128
-
129
-
130
-
131
-
132
-
133
-
134
-
135
-
136
-
137
-
138
-
139
-
140
-
141
-
142
-
143
-
144
-
145
-
146
-
147
-
148
 |
 |

51
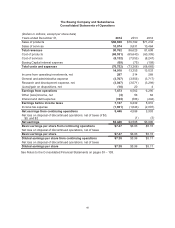
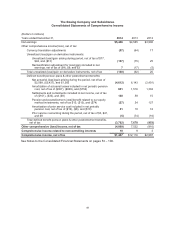
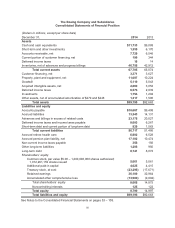
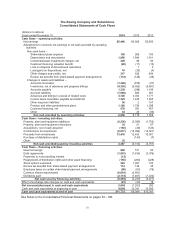
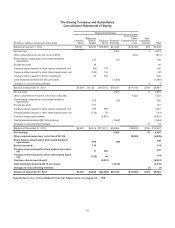
The Boeing Company and Subsidiaries
Consolidated Statements of Cash Flows
(Dollars in millions)
Years ended December 31, 2014 2013 2012
Cash flows – operating activities:
Net earnings $5,446 $4,585 $3,900
Adjustments to reconcile net earnings to net cash provided by operating
activities:
Non-cash items –
Share-based plans expense 195 206 193
Depreciation and amortization 1,906 1,844 1,811
Investment/asset impairment charges, net 229 96 84
Customer financing valuation benefit (28) (11) (10)
Loss on disposal of discontinued operations 1 5
Loss/(gain) on dispositions, net 10 (20) (4)
Other charges and credits, net 317 528 694
Excess tax benefits from share-based payment arrangements (114) (128) (45)
Changes in assets and liabilities –
Accounts receivable (1,328) (879) (27)
Inventories, net of advances and progress billings (4,330) (5,562) (5,681)
Accounts payable 1,339 (298) 1,199
Accrued liabilities (1,088) 883 801
Advances and billings in excess of related costs 3,145 3,353 1,177
Income taxes receivable, payable and deferred 1,325 1,445 1,605
Other long-term liabilities 36 2 157
Pension and other postretirement plans 1,186 1,720 1,288
Customer financing, net 578 391 407
Other 34 23 (46)
Net cash provided by operating activities 8,858 8,179 7,508
Cash flows – investing activities:
Property, plant and equipment additions (2,236) (2,098) (1,703)
Property, plant and equipment reductions 34 51 97
Acquisitions, net of cash acquired (163) (26) (124)
Contributions to investments (8,617) (15,394) (12,921)
Proceeds from investments 13,416 12,453 10,901
Purchase of distribution rights (140) (7)
Other 33
Net cash provided/(used) by investing activities 2,467 (5,154) (3,757)
Cash flows – financing activities:
New borrowings 962 571 60
Debt repayments (1,601) (1,434) (2,076)
Payments to noncontrolling interest (12)
Repayments of distribution rights and other asset financing (185) (280) (228)
Stock options exercised 343 1,097 120
Excess tax benefits from share-based payment arrangements 114 128 45
Employee taxes on certain share-based payment arrangements (98) (63) (76)
Common shares repurchased (6,001) (2,801)
Dividends paid (2,115) (1,467) (1,322)
Net cash used by financing activities (8,593) (4,249) (3,477)
Effect of exchange rate changes on cash and cash equivalents (87) (29) 18
Net increase/(decrease) in cash and cash equivalents 2,645 (1,253) 292
Cash and cash equivalents at beginning of year 9,088 10,341 10,049
Cash and cash equivalents at end of year $11,733 $9,088 $10,341
See Notes to the Consolidated Financial Statements on pages 53 –108.