Boeing 2014 Annual Report Download - page 31
Download and view the complete annual report
Please find page 31 of the 2014 Boeing annual report below. You can navigate through the pages in the report by either clicking on the pages listed below, or by using the keyword search tool below to find specific information within the annual report.-
 1
1 -
2
-
3
-
4
-
5
-
6
-
7
-
8
-
9
-
10
-
11
-
12
-
13
-
14
-
15
-
16
-
17
-
18
-
19
-
20
-
 21
21 -
 22
22 -
 23
23 -
 24
24 -
 25
25 -
 26
26 -
 27
27 -
 28
28 -
 29
29 -
 30
30 -
 31
31 -
 32
32 -
 33
33 -
 34
34 -
 35
35 -
 36
36 -
 37
37 -
 38
38 -
 39
39 -
 40
40 -
 41
41 -
42
-
43
-
44
-
45
-
46
-
47
-
48
-
49
-
50
-
51
-
52
-
53
-
54
-
55
-
56
-
57
-
58
-
59
-
60
-
61
-
62
-
63
-
64
-
65
-
66
-
67
-
68
-
69
-
70
-
71
-
72
-
73
-
74
-
75
-
76
-
77
-
78
-
79
-
80
-
81
-
82
-
83
-
84
-
85
-
86
-
87
-
88
-
89
-
90
-
91
-
92
-
93
-
94
-
95
-
96
-
97
-
98
-
99
-
100
-
101
-
102
-
103
-
104
-
105
-
106
-
107
-
108
-
109
-
110
-
111
-
112
-
113
-
114
-
115
-
116
-
117
-
118
-
119
-
120
-
121
-
122
-
123
-
124
-
125
-
126
-
127
-
128
-
129
-
130
-
131
-
132
-
133
-
134
-
135
-
136
-
137
-
138
-
139
-
140
-
141
-
142
-
143
-
144
-
145
-
146
-
147
-
148
 |
 |

19
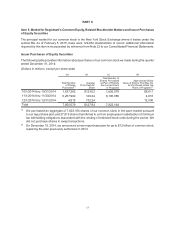
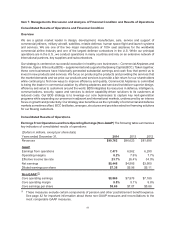
Item 7. Management’s Discussion and Analysis of Financial Condition and Results of Operations
Consolidated Results of Operations and Financial Condition
Overview
We are a global market leader in design, development, manufacture, sale, service and support of
commercial jetliners, military aircraft, satellites, missile defense, human space flight and launch systems
and services. We are one of the two major manufacturers of 100+ seat airplanes for the worldwide
commercial airline industry and one of the largest defense contractors in the U.S. While our principal
operations are in the U.S., we conduct operations in many countries and rely on an extensive network of
international partners, key suppliers and subcontractors.
Our strategy is centered on successful execution in healthy core businesses – Commercial Airplanes and
Defense, Space & Security (BDS) – supplemented and supported by Boeing Capital (BCC). Taken together,
these core businesses have historically generated substantial earnings and cash flow that permit us to
invest in new products and services. We focus on producing the products and providing the services that
the market demands and we price our products and services to provide a fair return for our shareholders
while continuing to find new ways to improve efficiency and quality. Commercial Airplanes is committed
to being the leader in commercial aviation by offering airplanes and services that deliver superior design,
efficiency and value to customers around the world. BDS integrates its resources in defense, intelligence,
communications, security, space and services to deliver capability-driven solutions to its customers at
reduced costs. Our BDS strategy is to leverage our core businesses to capture key next-generation
programs while expanding our presence in adjacent and international markets, underscored by an intense
focus on growth and productivity. Our strategy also benefits us as the cyclicality of commercial and defense
markets sometimes offset. BCC facilitates, arranges, structures and provides selective financing solutions
for our Boeing customers.
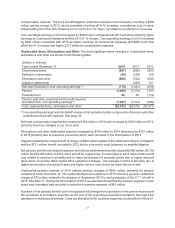
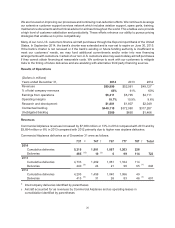
Consolidated Results of Operations
Earnings From Operations and Core Operating Earnings (Non-GAAP) The following table summarizes
key indicators of consolidated results of operations:
(Dollars in millions, except per share data)
Years ended December 31, 2014 2013 2012
Revenues $90,762 $86,623 $81,698
GAAP
Earnings from operations 7,473 6,562 6,290
Operating margins 8.2% 7.6% 7.7%
Effective income tax rate 23.7% 26.4% 34.0%
Net earnings $5,446 $4,585 $3,900
Diluted earnings per share $7.38 $5.96 $5.11
Non-GAAP (1)
Core operating earnings $8,860 $7,876 $7,189
Core operating margin 9.8% 9.1% 8.8%
Core earnings per share $8.60 $7.07 $5.88
(1) These measures exclude certain components of pension and other postretirement benefit expense.
See page 42 for important information about these non-GAAP measures and reconciliations to the
most comparable GAAP measures.