Boeing 2014 Annual Report Download - page 134
Download and view the complete annual report
Please find page 134 of the 2014 Boeing annual report below. You can navigate through the pages in the report by either clicking on the pages listed below, or by using the keyword search tool below to find specific information within the annual report.-
 1
1 -
2
-
3
-
4
-
5
-
6
-
7
-
8
-
9
-
10
-
11
-
12
-
13
-
14
-
15
-
16
-
17
-
18
-
19
-
20
-
21
-
22
-
23
-
24
-
25
-
26
-
27
-
28
-
29
-
30
-
31
-
32
-
33
-
34
-
35
-
36
-
37
-
38
-
39
-
40
-
41
-
42
-
43
-
44
-
45
-
46
-
47
-
48
-
49
-
50
-
51
-
52
-
53
-
54
-
55
-
56
-
57
-
58
-
59
-
60
-
61
-
62
-
63
-
64
-
65
-
66
-
67
-
68
-
69
-
70
-
71
-
72
-
73
-
74
-
75
-
76
-
77
-
78
-
79
-
80
-
81
-
82
-
83
-
84
-
85
-
86
-
87
-
88
-
89
-
90
-
91
-
92
-
93
-
94
-
95
-
96
-
97
-
98
-
99
-
100
-
101
-
102
-
103
-
104
-
105
-
106
-
107
-
108
-
109
-
110
-
111
-
112
-
113
-
114
-
115
-
116
-
117
-
118
-
119
-
120
-
121
-
122
-
123
-
 124
124 -
 125
125 -
 126
126 -
 127
127 -
 128
128 -
 129
129 -
 130
130 -
 131
131 -
 132
132 -
 133
133 -
 134
134 -
 135
135 -
 136
136 -
 137
137 -
 138
138 -
 139
139 -
 140
140 -
 141
141 -
 142
142 -
 143
143 -
 144
144 -
145
-
146
-
147
-
148
 |
 |

122
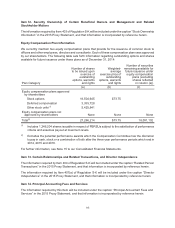
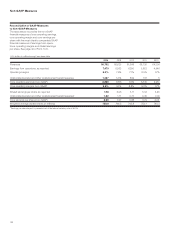
Non-GAAP Measures
Reconciliation of GAAP Measures
to Non-GAAP Measures
The table below reconciles the non-GAAP
financial measures of core operating earnings,
core operating margin and core earnings per
share with the most directly comparable GAAP
financial measures of earnings from opera-
tions, operating margins and diluted earnings
per share. See page 42 of Form 10-K.
2014 2013 2012 2011 2010
Revenues 90,762 86,623 81,698 68,735 64,306
Earnings from operations, as reported 7,473 6,562 6,290 5,823 4,946
Operating margins 8.2% 7.6% 7.7% 8.5% 7.7%
Unallocated pension and other postretirement benefit expense 1,387 1,314 899 517 5
Core operating earnings (non-GAAP) 8,860 7, 876 7,189 6,340 4,951
Core operating margins (non-GAAP) 9.8% 9.1% 8.8% 9.2% 7.7%
Diluted earnings per share, as reported 7. 38 5.96 5.11 5.34 4.45
Unallocated pension and other postretirement benefit expense* 1.22 1.11 0.77 0.45 0.00
Core earnings per share (non-GAAP) 8.60 7.07 5.88 5.79 4.45
Weighted average diluted shares (in millions) 738.0 769.5 763.8 753.1 744.3
*Earnings per share impact is presented net of the federal statutory rate of 35.0%.
U.S. dollars in millions except per share data