Boeing 2014 Annual Report Download - page 34
Download and view the complete annual report
Please find page 34 of the 2014 Boeing annual report below. You can navigate through the pages in the report by either clicking on the pages listed below, or by using the keyword search tool below to find specific information within the annual report.-
 1
1 -
2
-
3
-
4
-
5
-
6
-
7
-
8
-
9
-
10
-
11
-
12
-
13
-
14
-
15
-
16
-
17
-
18
-
19
-
20
-
21
-
22
-
23
-
 24
24 -
 25
25 -
 26
26 -
 27
27 -
 28
28 -
 29
29 -
 30
30 -
 31
31 -
 32
32 -
 33
33 -
 34
34 -
 35
35 -
 36
36 -
 37
37 -
 38
38 -
 39
39 -
 40
40 -
 41
41 -
 42
42 -
 43
43 -
 44
44 -
45
-
46
-
47
-
48
-
49
-
50
-
51
-
52
-
53
-
54
-
55
-
56
-
57
-
58
-
59
-
60
-
61
-
62
-
63
-
64
-
65
-
66
-
67
-
68
-
69
-
70
-
71
-
72
-
73
-
74
-
75
-
76
-
77
-
78
-
79
-
80
-
81
-
82
-
83
-
84
-
85
-
86
-
87
-
88
-
89
-
90
-
91
-
92
-
93
-
94
-
95
-
96
-
97
-
98
-
99
-
100
-
101
-
102
-
103
-
104
-
105
-
106
-
107
-
108
-
109
-
110
-
111
-
112
-
113
-
114
-
115
-
116
-
117
-
118
-
119
-
120
-
121
-
122
-
123
-
124
-
125
-
126
-
127
-
128
-
129
-
130
-
131
-
132
-
133
-
134
-
135
-
136
-
137
-
138
-
139
-
140
-
141
-
142
-
143
-
144
-
145
-
146
-
147
-
148
 |
 |

22
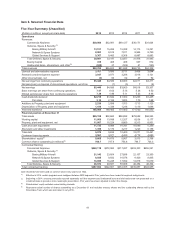
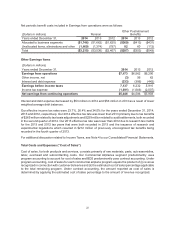
Net periodic benefit costs included in Earnings from operations were as follows:
(Dollars in millions) Pension Other Postretirement
Benefits
Years ended December 31, 2014 2013 2012 2014 2013 2012
Allocated to business segments ($1,746) ($1,662) ($1,620) ($369) ($413) ($431)
Unallocated items, eliminations and other (1,469)(1,374) (787) 82 60 (112)
Total ($3,215) ($3,036) ($2,407) ($287) ($353) ($543)
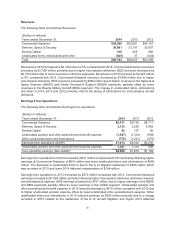
Other Earnings Items
(Dollars in millions)
Years ended December 31, 2014 2013 2012
Earnings from operations $7,473 $6,562 $6,290
Other income, net (3) 56 62
Interest and debt expense (333) (386) (442)
Earnings before income taxes 7,137 6,232 5,910
Income tax expense (1,691) (1,646) (2,007)
Net earnings from continuing operations $5,446 $4,586 $3,903
Interest and debt expense decreased by $53 million in 2014 and $56 million in 2013 as a result of lower
weighted average debt balances.
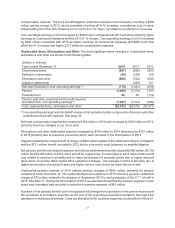
Our effective income tax rates were 23.7%, 26.4% and 34.0% for the years ended December 31, 2014,
2013 and 2012, respectively. Our 2014 effective tax rate was lower than 2013 primarily due to tax benefits
of $265 million related to tax basis adjustments and $259 million related to audit settlements, both recorded
in the second quarter of 2014. Our 2013 effective tax rate was lower than 2012 due to research tax credits
for the 2013 and 2012 tax years that were both recorded in 2013 and the issuance of research and
experimental regulations which resulted in $212 million of previously unrecognized tax benefits being
recorded in the fourth quarter of 2013.
For additional discussion related to Income Taxes, see Note 4 to our Consolidated Financial Statements.
Total Costs and Expenses (“Cost of Sales”)
Cost of sales, for both products and services, consists primarily of raw materials, parts, sub-assemblies,
labor, overhead and subcontracting costs. Our Commercial Airplanes segment predominantly uses
program accounting to account for cost of sales and BDS predominantly uses contract accounting. Under
program accounting, cost of sales for each commercial airplane program equals the product of (i) revenue
recognized in connection with customer deliveries and (ii) the estimated cost of sales percentage applicable
to the total remaining program. Under contract accounting, the amount reported as cost of sales is
determined by applying the estimated cost of sales percentage to the amount of revenue recognized.