Boeing 2014 Annual Report Download - page 114
Download and view the complete annual report
Please find page 114 of the 2014 Boeing annual report below. You can navigate through the pages in the report by either clicking on the pages listed below, or by using the keyword search tool below to find specific information within the annual report.-
 1
1 -
2
-
3
-
4
-
5
-
6
-
7
-
8
-
9
-
10
-
11
-
12
-
13
-
14
-
15
-
16
-
17
-
18
-
19
-
20
-
21
-
22
-
23
-
24
-
25
-
26
-
27
-
28
-
29
-
30
-
31
-
32
-
33
-
34
-
35
-
36
-
37
-
38
-
39
-
40
-
41
-
42
-
43
-
44
-
45
-
46
-
47
-
48
-
49
-
50
-
51
-
52
-
53
-
54
-
55
-
56
-
57
-
58
-
59
-
60
-
61
-
62
-
63
-
64
-
65
-
66
-
67
-
68
-
69
-
70
-
71
-
72
-
73
-
74
-
75
-
76
-
77
-
78
-
79
-
80
-
81
-
82
-
83
-
84
-
85
-
86
-
87
-
88
-
89
-
90
-
91
-
92
-
93
-
94
-
95
-
96
-
97
-
98
-
99
-
100
-
101
-
102
-
103
-
 104
104 -
 105
105 -
 106
106 -
 107
107 -
 108
108 -
 109
109 -
 110
110 -
 111
111 -
 112
112 -
 113
113 -
 114
114 -
 115
115 -
 116
116 -
 117
117 -
 118
118 -
 119
119 -
 120
120 -
 121
121 -
 122
122 -
 123
123 -
 124
124 -
125
-
126
-
127
-
128
-
129
-
130
-
131
-
132
-
133
-
134
-
135
-
136
-
137
-
138
-
139
-
140
-
141
-
142
-
143
-
144
-
145
-
146
-
147
-
148
 |
 |

102
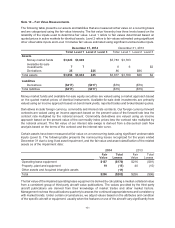
the more generic aircraft attributes covered by third party publications, or on the expected net sales price
for the aircraft.
Property, plant and equipment, Other assets and Acquired intangible assets were primarily valued using
an income approach based on the discounted cash flows associated with the underlying assets.
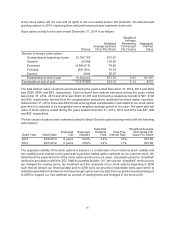
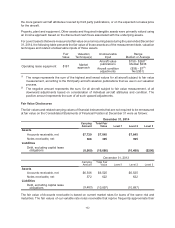
For Level 3 assets that were measured at fair value on a nonrecurring basis during the year ended December
31, 2014, the following table presents the fair value of those assets as of the measurement date, valuation
techniques and related unobservable inputs of those assets.
Fair
Value
Valuation
Technique(s)
Unobservable
Input
Range
Median or Average
Operating lease equipment $187 Market
approach
Aircraft value
publications
$158 - $268(1)
Median $238
Aircraft condition
adjustments
($58) - $7(2)
Net ($51)
(1) The range represents the sum of the highest and lowest values for all aircraft subject to fair value
measurement, according to the third party aircraft valuation publications that we use in our valuation
process.
(2) The negative amount represents the sum, for all aircraft subject to fair value measurement, of all
downward adjustments based on consideration of individual aircraft attributes and condition. The
positive amount represents the sum of all such upward adjustments.
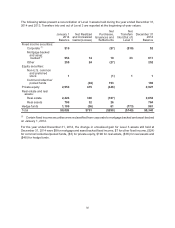
Fair Value Disclosures
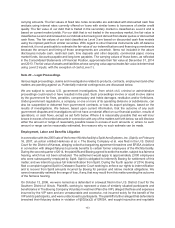
The fair values and related carrying values of financial instruments that are not required to be remeasured
at fair value on the Consolidated Statements of Financial Position at December 31 were as follows:
December 31, 2014
Carrying
Amount
Total Fair
Value Level 1 Level 2 Level 3
Assets
Accounts receivable, net $7,729 $7,845 $7,845
Notes receivable, net 366 395 395
Liabilities
Debt, excluding capital lease
obligations (8,909) (10,686) (10,480) ($206)
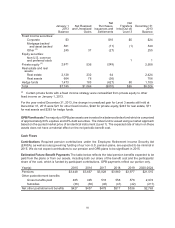
December 31, 2013
Carrying
Amount
Total Fair
Value Level 1 Level 2 Level 3
Assets
Accounts receivable, net $6,546 $6,525 $6,525
Notes receivable, net 572 622 622
Liabilities
Debt, excluding capital lease
obligations (9,483) (10,897) (10,897)
The fair value of Accounts receivable is based on current market rates for loans of the same risk and
maturities. The fair values of our variable rate notes receivable that reprice frequently approximate their