Boeing 2014 Annual Report Download - page 50
Download and view the complete annual report
Please find page 50 of the 2014 Boeing annual report below. You can navigate through the pages in the report by either clicking on the pages listed below, or by using the keyword search tool below to find specific information within the annual report.-
 1
1 -
2
-
3
-
4
-
5
-
6
-
7
-
8
-
9
-
10
-
11
-
12
-
13
-
14
-
15
-
16
-
17
-
18
-
19
-
20
-
21
-
22
-
23
-
24
-
25
-
26
-
27
-
28
-
29
-
30
-
31
-
32
-
33
-
34
-
35
-
36
-
37
-
38
-
39
-
 40
40 -
 41
41 -
 42
42 -
 43
43 -
 44
44 -
 45
45 -
 46
46 -
 47
47 -
 48
48 -
 49
49 -
 50
50 -
 51
51 -
 52
52 -
 53
53 -
 54
54 -
 55
55 -
 56
56 -
 57
57 -
 58
58 -
 59
59 -
 60
60 -
61
-
62
-
63
-
64
-
65
-
66
-
67
-
68
-
69
-
70
-
71
-
72
-
73
-
74
-
75
-
76
-
77
-
78
-
79
-
80
-
81
-
82
-
83
-
84
-
85
-
86
-
87
-
88
-
89
-
90
-
91
-
92
-
93
-
94
-
95
-
96
-
97
-
98
-
99
-
100
-
101
-
102
-
103
-
104
-
105
-
106
-
107
-
108
-
109
-
110
-
111
-
112
-
113
-
114
-
115
-
116
-
117
-
118
-
119
-
120
-
121
-
122
-
123
-
124
-
125
-
126
-
127
-
128
-
129
-
130
-
131
-
132
-
133
-
134
-
135
-
136
-
137
-
138
-
139
-
140
-
141
-
142
-
143
-
144
-
145
-
146
-
147
-
148
 |
 |

38
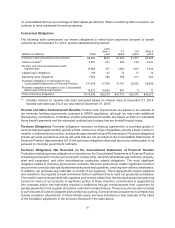
BCC enters into certain transactions with Boeing, reflected in Unallocated items, eliminations and other,
in the form of intercompany guarantees and other subsidies that mitigate the effects of certain credit quality
or asset impairment issues on the BCC segment.
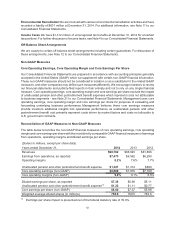
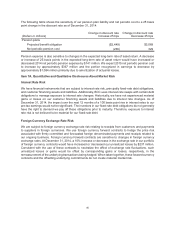
On October 31, 2014, Boeing issued $850 million of fixed and floating rate notes and entered into a
concurrent intercompany loan on the same terms with BCC for $550 million, comprised of $300 million of
fixed rate notes and $250 million of floating rate notes. Interest expense associated with these intercompany
notes is included in Boeing Capital interest expense. See Note 13.
Restructurings and Restructuring Requests
From time to time, certain customers have requested a restructuring of their transactions with BCC. During
2014, BCC did not reach agreement on any restructuring requests that would have a material effect on
our earnings, cash flows and/or financial position.
Liquidity and Capital Resources
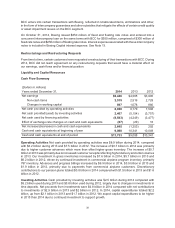
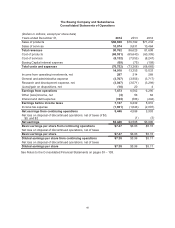
Cash Flow Summary
(Dollars in millions)
Years ended December 31, 2014 2013 2012
Net earnings $5,446 $4,585 $3,900
Non-cash items 2,515 2,516 2,728
Changes in working capital 897 1,078 880
Net cash provided by operating activities 8,858 8,179 7,508
Net cash provided/(used) by investing activities 2,467 (5,154) (3,757)
Net cash used by financing activities (8,593) (4,249) (3,477)
Effect of exchange rate changes on cash and cash equivalents (87) (29) 18
Net increase/(decrease) in cash and cash equivalents 2,645 (1,253) 292
Cash and cash equivalents at beginning of year 9,088 10,341 10,049
Cash and cash equivalents at end of period $11,733 $9,088 $10,341
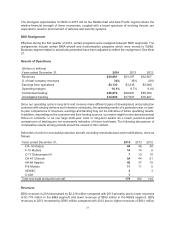
Operating Activities Net cash provided by operating activities was $8.9 billion during 2014, compared
with $8.2 billion during 2013 and $7.5 billion in 2012. The increase of $0.7 billion in 2014 was primarily
due to higher customer advances which more than offset higher gross inventory. The increase of $0.7
billion in 2013 was primarily due to increased customer receipts reflecting higher delivery and order volumes
in 2013. Our investment in gross inventories increased by $7.6 billion in 2014, $5.7 billion in 2013 and
$6.2 billion in 2012, driven by continued investment in commercial airplane program inventory, primarily
787 inventory. Advances and progress billings increased by $6.9 billion in 2014, $3.9 billion in 2013 and
$1.9 billion in 2012, primarily due to payments from commercial airplane customers. Discretionary
contributions to our pension plans totaled $0.8 billion in 2014 compared with $1.5 billion in 2013 and $1.6
billion in 2012.
Investing Activities Cash provided by investing activities was $2.5 billion during 2014 compared with
$5.2 billion used during 2013 and $3.8 billion used during 2012, largely due to changes in investments in
time deposits. Net proceeds from investments were $4.8 billion in 2014 compared with net contributions
to investments of $2.9 billion in 2013 and $2 billion in 2012. In 2014, capital expenditures totaled $2.2
billion, up from $2.1 billion in 2013 and $1.7 billion in 2012. We expect capital expenditures to be higher
in 2015 than 2014 due to continued investment to support growth.