Allstate 2012 Annual Report Download - page 55
Download and view the complete annual report
Please find page 55 of the 2012 Allstate annual report below. You can navigate through the pages in the report by either clicking on the pages listed below, or by using the keyword search tool below to find specific information within the annual report.-
 1
1 -
2
-
3
-
4
-
5
-
6
-
7
-
8
-
9
-
10
-
11
-
12
-
13
-
14
-
15
-
16
-
17
-
18
-
19
-
20
-
21
-
22
-
23
-
24
-
25
-
26
-
27
-
28
-
29
-
30
-
31
-
32
-
33
-
34
-
35
-
36
-
37
-
38
-
39
-
40
-
41
-
42
-
43
-
44
-
 45
45 -
 46
46 -
 47
47 -
 48
48 -
 49
49 -
 50
50 -
 51
51 -
 52
52 -
 53
53 -
 54
54 -
 55
55 -
 56
56 -
 57
57 -
 58
58 -
 59
59 -
 60
60 -
 61
61 -
 62
62 -
 63
63 -
 64
64 -
 65
65 -
66
-
67
-
68
-
69
-
70
-
71
-
72
-
73
-
74
-
75
-
76
-
77
-
78
-
79
-
80
-
81
-
82
-
83
-
84
-
85
-
86
-
87
-
88
-
89
-
90
-
91
-
92
-
93
-
94
-
95
-
96
-
97
-
98
-
99
-
100
-
101
-
102
-
103
-
104
-
105
-
106
-
107
-
108
-
109
-
110
-
111
-
112
-
113
-
114
-
115
-
116
-
117
-
118
-
119
-
120
-
121
-
122
-
123
-
124
-
125
-
126
-
127
-
128
-
129
-
130
-
131
-
132
-
133
-
134
-
135
-
136
-
137
-
138
-
139
-
140
-
141
-
142
-
143
-
144
-
145
-
146
-
147
-
148
-
149
-
150
-
151
-
152
-
153
-
154
-
155
-
156
-
157
-
158
-
159
-
160
-
161
-
162
-
163
-
164
-
165
-
166
-
167
-
168
-
169
-
170
-
171
-
172
-
173
-
174
-
175
-
176
-
177
-
178
-
179
-
180
-
181
-
182
-
183
-
184
-
185
-
186
-
187
-
188
-
189
-
190
-
191
-
192
-
193
-
194
-
195
-
196
-
197
-
198
-
199
-
200
-
201
-
202
-
203
-
204
-
205
-
206
-
207
-
208
-
209
-
210
-
211
-
212
-
213
-
214
-
215
-
216
-
217
-
218
-
219
-
220
-
221
-
222
-
223
-
224
-
225
-
226
-
227
-
228
-
229
-
230
-
231
-
232
-
233
-
234
-
235
-
236
-
237
-
238
-
239
-
240
-
241
-
242
-
243
-
244
-
245
-
246
-
247
-
248
-
249
-
250
-
251
-
252
-
253
-
254
-
255
-
256
-
257
-
258
-
259
-
260
-
261
-
262
-
263
-
264
-
265
-
266
-
267
-
268
 |
 |

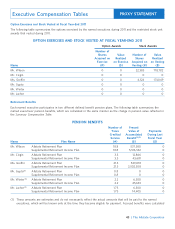
as of December 31, 2011, and used to calculate the present value of accumulated benefits at December 31, 2011.
December 31 is our pension plan measurement date used for financial statement reporting purposes.
The amounts listed in this column are based on the following assumptions:
• Discount rate of 5.25%, payment form assuming 80% paid as a lump sum and 20% paid as an annuity,
lump-sum/annuity conversion segmented interest rates of 4.75% for the first five years, 6.25% for the next
15 years, and 6.75% for all years after 20 and the 2012 combined static Pension Protection Act funding mortality
table with a blend of 50% males and 50% females (as required under the Internal Revenue Code), and
post-retirement mortality for annuitants using the 2012 Internal Revenue Service mandated annuitant table; these
are the same as those used for financial reporting year-end disclosure as described in the notes to Allstate’s
consolidated financial statements. (See note 17 to our audited financial statements for 2011.)
• Based on guidance provided by the Securities and Exchange Commission, we have assumed a normal retirement
age of 65 under both the ARP and SRIP, regardless of any announced or anticipated retirements.
• No assumption for early termination, disability, or pre-retirement mortality.
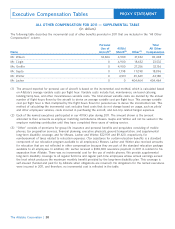
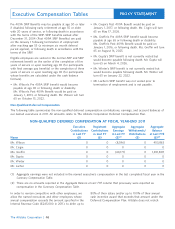
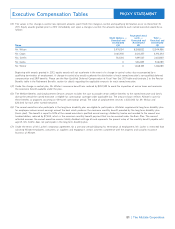
(2) The figures shown in the table above reflect the present value of the current accrued pension benefits calculated
using the assumptions described in the preceding footnote. If the named executives’ employment terminated on
December 31, 2011, the lump sum present value of the non-qualified pension benefits for each named executive
earned through December 31, 2011, is shown in the following table:
Mr. Wilson Supplemental Retirement Income Plan $6,683,270
Mr. Civgin Supplemental Retirement Income Plan $43,681
Ms. Greffin Supplemental Retirement Income Plan $3,084,597
Mr. Gupta Supplemental Retirement Income Plan $0
Mr. Winter Supplemental Retirement Income Plan $45,633
Mr. Lacher Supplemental Retirement Income Plan $0
The amount shown is based on the lump sum methodology (i.e., interest rate and mortality table) used by the
Allstate pension plans in 2012, as required under the Pension Protection Act. Specifically, the interest rate for 2012
is based on 100% of the average corporate bond segmented yield curve from August of the prior year. The mortality
table for 2012 is the 2012 combined static Pension Protection Act funding mortality table with a blend of 50%
males and 50% females, as required under the Internal Revenue Code.
(3) Messrs. Gupta and Winter are not currently vested in the Allstate Retirement Plan or the Supplemental Retirement
Income Plan.
(4) Mr. Lacher was not vested in the Allstate Retirement Plan or the Supplemental Retirement Income Plan as of the
date his employment terminated, July 17, 2011. The present values were determined based on his nonvested benefit.
The benefits and value of benefits shown in the Pension Messrs. Civgin, Gupta, and Winter are eligible to earn
Benefits table are based on the following material factors: cash balance benefits. Benefits under the final average pay
formula are earned and stated in the form of a straight
Allstate Retirement Plan (ARP) life annuity payable at the normal retirement age 65.
Participants who earn final average pay benefits may do
The ARP has two different types of benefit formulas (final so under one or more benefit formulas based on when
average pay and cash balance) which apply to they became ARP members and their years of service.
participants based on their date of hire or the individual
choices they made before a cash balance plan was Ms. Greffin and Mr. Wilson have earned ARP benefits
introduced on January 1, 2003. Of the named executives, under the post-1988 final average pay formula which is
44
Lump Sum
Name Plan Name Amount ($)
Executive Compensation Tables
The Allstate Corporation |
PROXY STATEMENT