Allstate 2012 Annual Report Download - page 161
Download and view the complete annual report
Please find page 161 of the 2012 Allstate annual report below. You can navigate through the pages in the report by either clicking on the pages listed below, or by using the keyword search tool below to find specific information within the annual report.-
 1
1 -
2
-
3
-
4
-
5
-
6
-
7
-
8
-
9
-
10
-
11
-
12
-
13
-
14
-
15
-
16
-
17
-
18
-
19
-
20
-
21
-
22
-
23
-
24
-
25
-
26
-
27
-
28
-
29
-
30
-
31
-
32
-
33
-
34
-
35
-
36
-
37
-
38
-
39
-
40
-
41
-
42
-
43
-
44
-
45
-
46
-
47
-
48
-
49
-
50
-
51
-
52
-
53
-
54
-
55
-
56
-
57
-
58
-
59
-
60
-
61
-
62
-
63
-
64
-
65
-
66
-
67
-
68
-
69
-
70
-
71
-
72
-
73
-
74
-
75
-
76
-
77
-
78
-
79
-
80
-
81
-
82
-
83
-
84
-
85
-
86
-
87
-
88
-
89
-
90
-
91
-
92
-
93
-
94
-
95
-
96
-
97
-
98
-
99
-
100
-
101
-
102
-
103
-
104
-
105
-
106
-
107
-
108
-
109
-
110
-
111
-
112
-
113
-
114
-
115
-
116
-
117
-
118
-
119
-
120
-
121
-
122
-
123
-
124
-
125
-
126
-
127
-
128
-
129
-
130
-
131
-
132
-
133
-
134
-
135
-
136
-
137
-
138
-
139
-
140
-
141
-
142
-
143
-
144
-
145
-
146
-
147
-
148
-
149
-
150
-
 151
151 -
 152
152 -
 153
153 -
 154
154 -
 155
155 -
 156
156 -
 157
157 -
 158
158 -
 159
159 -
 160
160 -
 161
161 -
 162
162 -
 163
163 -
 164
164 -
 165
165 -
 166
166 -
 167
167 -
 168
168 -
 169
169 -
 170
170 -
 171
171 -
172
-
173
-
174
-
175
-
176
-
177
-
178
-
179
-
180
-
181
-
182
-
183
-
184
-
185
-
186
-
187
-
188
-
189
-
190
-
191
-
192
-
193
-
194
-
195
-
196
-
197
-
198
-
199
-
200
-
201
-
202
-
203
-
204
-
205
-
206
-
207
-
208
-
209
-
210
-
211
-
212
-
213
-
214
-
215
-
216
-
217
-
218
-
219
-
220
-
221
-
222
-
223
-
224
-
225
-
226
-
227
-
228
-
229
-
230
-
231
-
232
-
233
-
234
-
235
-
236
-
237
-
238
-
239
-
240
-
241
-
242
-
243
-
244
-
245
-
246
-
247
-
248
-
249
-
250
-
251
-
252
-
253
-
254
-
255
-
256
-
257
-
258
-
259
-
260
-
261
-
262
-
263
-
264
-
265
-
266
-
267
-
268
 |
 |

whether a security’s decline in fair value is other than temporary has placed greater emphasis on our analysis of the
underlying credit and collateral and related estimates of future cash flows.
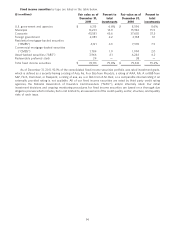
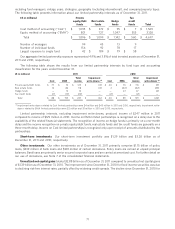
The following table summarizes the fair value and gross unrealized losses of fixed income securities by type and
investment grade classification as of December 31, 2011.
Below
Investment grade investment grade Total($ in millions)
Fair Unrealized Fair Unrealized Fair Unrealized
value losses value losses value losses
U.S. government and agencies $ 61 $ — $ — $ — $ 61 $ —
Municipal 1,536 (155) 485 (101) 2,021 (256)
Corporate 3,625 (305) 1,087 (74) 4,712 (379)
Foreign government 86 (1) — — 86 (1)
RMBS 443 (63) 1,112 (458) 1,555 (521)
CMBS 707 (130) 160 (96) 867 (226)
ABS 1,795 (191) 185 (96) 1,980 (287)
Total $ 8,253 $ (845) $ 3,029 $ (825) $ 11,282 $ (1,670)
We have experienced declines in the fair values of fixed income securities primarily due to wider credit spreads
resulting from higher risk premiums since the time of initial purchase, largely due to macroeconomic conditions and
credit market deterioration, including the impact of lower real estate valuations, which show signs of stabilization or
recovery in certain geographic areas but remain under stress in other geographic areas. Consistent with their ratings, our
portfolio monitoring process indicates that investment grade securities have a low risk of default. Securities rated below
investment grade, comprising securities with a rating of Ba, B and Caa or lower, have a higher risk of default. As of
December 31, 2011, 40% of our below investment grade gross unrealized losses related to Subprime RMBS.
Fair values for our structured securities are obtained from third-party valuation service providers and are subject to
review as disclosed in our Application of Critical Accounting Estimates. In accordance with GAAP, when fair value is less
than the amortized cost of a security and we have not made the decision to sell the security and it is not more likely than
not we will be required to sell the security before recovery of its amortized cost basis, we evaluate if we expect to receive
cash flows sufficient to recover the entire amortized cost basis of the security. We calculate the estimated recovery
value by discounting our best estimate of future cash flows at the security’s original or current effective rate, as
appropriate, and compare this to the amortized cost of the security. If we do not expect to receive cash flows sufficient
to recover the entire amortized cost basis of the security, the credit loss component of the impairment is recorded in
earnings, with the remaining amount of the unrealized loss related to other factors (‘‘non-credit-related’’) recognized in
other comprehensive income.
The non-credit-related unrealized losses for our structured securities, including our below investment grade
Subprime, are heavily influenced by risk factors other than those related to our best estimate of future cash flows. The
difference between these securities’ original or current effective rates and the yields implied by their fair value indicates
that a higher risk premium is included in the valuation of these securities than existed at initial issue or purchase. This
risk premium represents the return that a market participant requires as compensation to assume the risk associated
with the uncertainties regarding the future performance of the underlying collateral. The risk premium is comprised of:
default risk, which reflects the probability of default and the uncertainty related to collection of contractual principal and
interest; liquidity risk, which reflects the risk associated with exiting the investment in an illiquid market, both in terms of
timeliness and cost; and volatility risk, which reflects the potential valuation volatility during an investor’s holding period.
Other factors reflected in the risk premium include the costs associated with underwriting, monitoring and holding
these types of complex securities. Certain aspects of the default risk are included in the development of our best
estimate of future cash flows, as appropriate. Other aspects of the risk premium are considered to be temporary in
nature and are expected to reverse over the remaining lives of the securities as future cash flows are received.
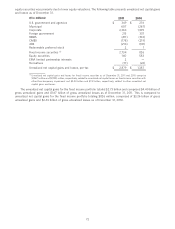
Other-than-temporary impairment assessment for below investment grade Subprime RMBS
As of December 31, 2011, the fair value of our below investment grade Subprime securities with gross unrealized
losses totaled $586 million, a decrease of 26.4% compared to $796 million as of December 31, 2010, primarily due to
sales. As of December 31, 2011, gross unrealized losses for our below investment grade Subprime portfolio totaled
$334 million, an improvement of 23.7% compared to $438 million as of December 31, 2010, due to impairment write-
downs, sales and principal collections, partially offset by the downgrade of certain securities to below investment grade
75