Allstate 2012 Annual Report Download - page 153
Download and view the complete annual report
Please find page 153 of the 2012 Allstate annual report below. You can navigate through the pages in the report by either clicking on the pages listed below, or by using the keyword search tool below to find specific information within the annual report.-
 1
1 -
2
-
3
-
4
-
5
-
6
-
7
-
8
-
9
-
10
-
11
-
12
-
13
-
14
-
15
-
16
-
17
-
18
-
19
-
20
-
21
-
22
-
23
-
24
-
25
-
26
-
27
-
28
-
29
-
30
-
31
-
32
-
33
-
34
-
35
-
36
-
37
-
38
-
39
-
40
-
41
-
42
-
43
-
44
-
45
-
46
-
47
-
48
-
49
-
50
-
51
-
52
-
53
-
54
-
55
-
56
-
57
-
58
-
59
-
60
-
61
-
62
-
63
-
64
-
65
-
66
-
67
-
68
-
69
-
70
-
71
-
72
-
73
-
74
-
75
-
76
-
77
-
78
-
79
-
80
-
81
-
82
-
83
-
84
-
85
-
86
-
87
-
88
-
89
-
90
-
91
-
92
-
93
-
94
-
95
-
96
-
97
-
98
-
99
-
100
-
101
-
102
-
103
-
104
-
105
-
106
-
107
-
108
-
109
-
110
-
111
-
112
-
113
-
114
-
115
-
116
-
117
-
118
-
119
-
120
-
121
-
122
-
123
-
124
-
125
-
126
-
127
-
128
-
129
-
130
-
131
-
132
-
133
-
134
-
135
-
136
-
137
-
138
-
139
-
140
-
141
-
142
-
 143
143 -
 144
144 -
 145
145 -
 146
146 -
 147
147 -
 148
148 -
 149
149 -
 150
150 -
 151
151 -
 152
152 -
 153
153 -
 154
154 -
 155
155 -
 156
156 -
 157
157 -
 158
158 -
 159
159 -
 160
160 -
 161
161 -
 162
162 -
 163
163 -
164
-
165
-
166
-
167
-
168
-
169
-
170
-
171
-
172
-
173
-
174
-
175
-
176
-
177
-
178
-
179
-
180
-
181
-
182
-
183
-
184
-
185
-
186
-
187
-
188
-
189
-
190
-
191
-
192
-
193
-
194
-
195
-
196
-
197
-
198
-
199
-
200
-
201
-
202
-
203
-
204
-
205
-
206
-
207
-
208
-
209
-
210
-
211
-
212
-
213
-
214
-
215
-
216
-
217
-
218
-
219
-
220
-
221
-
222
-
223
-
224
-
225
-
226
-
227
-
228
-
229
-
230
-
231
-
232
-
233
-
234
-
235
-
236
-
237
-
238
-
239
-
240
-
241
-
242
-
243
-
244
-
245
-
246
-
247
-
248
-
249
-
250
-
251
-
252
-
253
-
254
-
255
-
256
-
257
-
258
-
259
-
260
-
261
-
262
-
263
-
264
-
265
-
266
-
267
-
268
 |
 |

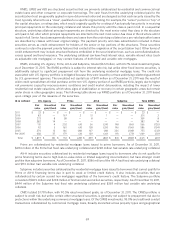
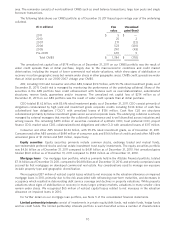
The following table summarizes the fair value and unrealized net capital gains and losses for fixed income securities
by credit rating as of December 31, 2011.
Aaa Aa A
($ in millions)
Fair Unrealized Fair Unrealized Fair Unrealized
value gain/(loss) value gain/(loss) value gain/(loss)
U.S. government and agencies $ 6,315 $ 349 $ — $ — $ — $ —
Municipal
Tax exempt 901 61 4,557 227 2,134 106
Taxable 208 23 2,690 289 1,093 79
ARS 511 (37) 91 (13) 78 (14)
Corporate
Public 1,000 61 2,816 180 11,716 793
Privately placed 1,029 48 1,524 90 4,173 274
Foreign government 821 124 478 35 486 29
RMBS
U.S. government sponsored entities
(‘‘U.S. Agency’’) 1,897 80 — — — —
Prime residential mortgage-backed
securities (‘‘Prime’’) 185 2 55 — 161 2
Alt-A residential mortgage-backed securities
(‘‘Alt-A’’) — — 40 (1) 68 —
Subprime residential mortgage-backed
securities (‘‘Subprime’’) — — 52 (18) 43 (7)
CMBS 941 33 214 (5) 166 (31)
ABS
Collateralized debt obligations (‘‘CDO’’) 117 (2) 750 (34) 340 (74)
Consumer and other asset-backed securities
(‘‘Consumer and other ABS’’) 1,418 34 306 2 360 2
Redeemable preferred stock — — 1 — — —
Total fixed income securities $ 15,343 $ 776 $ 13,574 $ 752 $ 20,818 $ 1,159
Baa Ba or lower Total
Fair Unrealized Fair Unrealized Fair Unrealized
value gain/(loss) value gain/(loss) value gain/(loss)
U.S. government and agencies $ — $ — $ — $ — $ 6,315 $ 349
Municipal
Tax exempt 966 9 447 (59) 9,005 344
Taxable 394 (26) 109 (22) 4,494 343
ARS — — 62 (16) 742 (80)
Corporate
Public 11,468 710 2,405 19 29,405 1,763
Privately placed 6,385 202 1,065 (13) 14,176 601
Foreign government 296 27 — — 2,081 215
RMBS
U.S. Agency — — — — 1,897 80
Prime 36 — 475 (32) 912 (28)
Alt-A 27 — 364 (79) 499 (80)
Subprime 61 (30) 657 (328) 813 (383)
CMBS 293 (83) 170 (92) 1,784 (178)
ABS
CDO 183 (64) 234 (79) 1,624 (253)
Consumer and other ABS 241 3 17 (2) 2,342 39
Redeemable preferred stock 23 2 — — 24 2
Total fixed income securities $ 20,373 $ 750 $ 6,005 $ (703) $ 76,113 $ 2,734
67