Allstate 2012 Annual Report Download - page 126
Download and view the complete annual report
Please find page 126 of the 2012 Allstate annual report below. You can navigate through the pages in the report by either clicking on the pages listed below, or by using the keyword search tool below to find specific information within the annual report.-
 1
1 -
2
-
3
-
4
-
5
-
6
-
7
-
8
-
9
-
10
-
11
-
12
-
13
-
14
-
15
-
16
-
17
-
18
-
19
-
20
-
21
-
22
-
23
-
24
-
25
-
26
-
27
-
28
-
29
-
30
-
31
-
32
-
33
-
34
-
35
-
36
-
37
-
38
-
39
-
40
-
41
-
42
-
43
-
44
-
45
-
46
-
47
-
48
-
49
-
50
-
51
-
52
-
53
-
54
-
55
-
56
-
57
-
58
-
59
-
60
-
61
-
62
-
63
-
64
-
65
-
66
-
67
-
68
-
69
-
70
-
71
-
72
-
73
-
74
-
75
-
76
-
77
-
78
-
79
-
80
-
81
-
82
-
83
-
84
-
85
-
86
-
87
-
88
-
89
-
90
-
91
-
92
-
93
-
94
-
95
-
96
-
97
-
98
-
99
-
100
-
101
-
102
-
103
-
104
-
105
-
106
-
107
-
108
-
109
-
110
-
111
-
112
-
113
-
114
-
115
-
 116
116 -
 117
117 -
 118
118 -
 119
119 -
 120
120 -
 121
121 -
 122
122 -
 123
123 -
 124
124 -
 125
125 -
 126
126 -
 127
127 -
 128
128 -
 129
129 -
 130
130 -
 131
131 -
 132
132 -
 133
133 -
 134
134 -
 135
135 -
 136
136 -
137
-
138
-
139
-
140
-
141
-
142
-
143
-
144
-
145
-
146
-
147
-
148
-
149
-
150
-
151
-
152
-
153
-
154
-
155
-
156
-
157
-
158
-
159
-
160
-
161
-
162
-
163
-
164
-
165
-
166
-
167
-
168
-
169
-
170
-
171
-
172
-
173
-
174
-
175
-
176
-
177
-
178
-
179
-
180
-
181
-
182
-
183
-
184
-
185
-
186
-
187
-
188
-
189
-
190
-
191
-
192
-
193
-
194
-
195
-
196
-
197
-
198
-
199
-
200
-
201
-
202
-
203
-
204
-
205
-
206
-
207
-
208
-
209
-
210
-
211
-
212
-
213
-
214
-
215
-
216
-
217
-
218
-
219
-
220
-
221
-
222
-
223
-
224
-
225
-
226
-
227
-
228
-
229
-
230
-
231
-
232
-
233
-
234
-
235
-
236
-
237
-
238
-
239
-
240
-
241
-
242
-
243
-
244
-
245
-
246
-
247
-
248
-
249
-
250
-
251
-
252
-
253
-
254
-
255
-
256
-
257
-
258
-
259
-
260
-
261
-
262
-
263
-
264
-
265
-
266
-
267
-
268
 |
 |

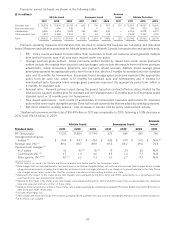
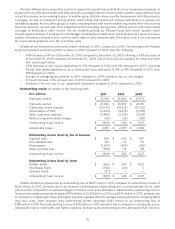
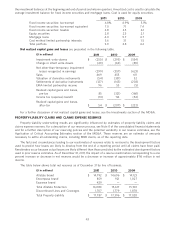
income over the period in which premiums are earned. The balance of DAC for each product type as of December 31 is
included in the following table.
Esurance
($ in millions) Allstate brand Encompass brand brand Allstate Protection
2011 2010 2011 2010 2011 2011 2010
Standard auto $ 533 $ 541 $ 52 $ 55 $ 32 (1) $ 617 $ 596
Non-standard auto 26 25 — — — 26 25
Homeowners 439 437 34 36 — 473 473
Other personal lines 289 276 7 7 — 296 283
Total DAC $ 1,287 $ 1,279 $ 93 $ 98 $ 32 $ 1,412 $ 1,377
(1) Includes $21 million of present value of future profits, which will be fully amortized by March 31, 2012.
On January 1, 2012, we will adopt new DAC accounting guidance on a retrospective basis (see Note 2 of the
consolidated financial statements for further details). It is currently estimated that the restated Allstate Protection DAC
balance will decline by $63 million when compared to the reported December 31, 2011 balance. We estimate that the
new DAC accounting guidance will have an insignificant effect on net income in 2012.
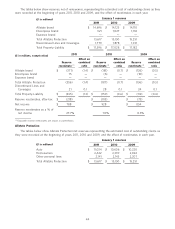
Catastrophe management
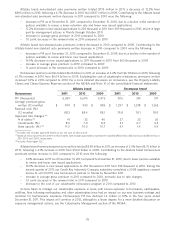
Historical catastrophe experience Since the beginning of 1992, the average annual impact of catastrophes on our
Property-Liability loss ratio was 8.0 points. However, this average does not reflect the impact of some of the more
significant actions we have taken to limit our catastrophe exposure. Consequently, it is useful to consider the impact of
catastrophes after excluding losses that are now partially or substantially covered by the California Earthquake
Authority (‘‘CEA’’), the Florida Hurricane Catastrophe Fund (‘‘FHCF’’) or placed with a third party, such as hurricane
coverage in Hawaii. The average annual impact of all catastrophes, excluding losses from Hurricanes Andrew and Iniki
and losses from California earthquakes, on our Property-Liability loss ratio was 7.0 points since the beginning of 1992.
Comparatively, the average annual impact of catastrophes on the homeowners loss ratio for the years 1992 through
2011 is shown in the following table.
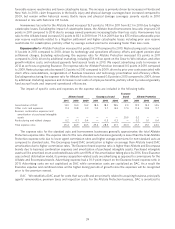
Average annual impact of catastrophes on the
Average annual impact of homeowners loss ratio excluding losses from
catastrophes on the hurricanes Andrew and Iniki, and losses from
homeowners loss ratio California earthquakes
Florida 95.6 46.5
Other hurricane exposure states 30.5 30.3
Total hurricane exposure states 35.5 31.6
All other 25.0 20.6
Total 30.6 26.5
Over time, we have limited our aggregate insurance exposure to catastrophe losses in certain regions of the country
that are subject to high levels of natural catastrophes. Limitations include our participation in various state facilities,
such as the CEA, which provides insurance for California earthquake losses; the FHCF, which provides reimbursements
to participating insurers for certain qualifying Florida hurricane losses; and other state facilities, such as wind pools.
However, the impact of these actions may be diminished by the growth in insured values, and the effect of state
insurance laws and regulations. In addition, in various states we are required to participate in assigned risk plans,
reinsurance facilities and joint underwriting associations that provide insurance coverage to individuals or entities that
otherwise are unable to purchase such coverage from private insurers. Because of our participation in these and other
state facilities such as wind pools, we may be exposed to losses that surpass the capitalization of these facilities and to
assessments from these facilities.
We continue to take actions to maintain an appropriate level of exposure to catastrophic events while continuing to
meet the needs of our customers, including the following:
• Selectively not offering continuing coverage of mono-line homeowners policies in coastal areas of certain
states.
• Increased capacity in our brokerage platform for customers not offered a renewal.
40