Allstate 2012 Annual Report Download - page 112
Download and view the complete annual report
Please find page 112 of the 2012 Allstate annual report below. You can navigate through the pages in the report by either clicking on the pages listed below, or by using the keyword search tool below to find specific information within the annual report.-
 1
1 -
2
-
3
-
4
-
5
-
6
-
7
-
8
-
9
-
10
-
11
-
12
-
13
-
14
-
15
-
16
-
17
-
18
-
19
-
20
-
21
-
22
-
23
-
24
-
25
-
26
-
27
-
28
-
29
-
30
-
31
-
32
-
33
-
34
-
35
-
36
-
37
-
38
-
39
-
40
-
41
-
42
-
43
-
44
-
45
-
46
-
47
-
48
-
49
-
50
-
51
-
52
-
53
-
54
-
55
-
56
-
57
-
58
-
59
-
60
-
61
-
62
-
63
-
64
-
65
-
66
-
67
-
68
-
69
-
70
-
71
-
72
-
73
-
74
-
75
-
76
-
77
-
78
-
79
-
80
-
81
-
82
-
83
-
84
-
85
-
86
-
87
-
88
-
89
-
90
-
91
-
92
-
93
-
94
-
95
-
96
-
97
-
98
-
99
-
100
-
101
-
 102
102 -
 103
103 -
 104
104 -
 105
105 -
 106
106 -
 107
107 -
 108
108 -
 109
109 -
 110
110 -
 111
111 -
 112
112 -
 113
113 -
 114
114 -
 115
115 -
 116
116 -
 117
117 -
 118
118 -
 119
119 -
 120
120 -
 121
121 -
 122
122 -
123
-
124
-
125
-
126
-
127
-
128
-
129
-
130
-
131
-
132
-
133
-
134
-
135
-
136
-
137
-
138
-
139
-
140
-
141
-
142
-
143
-
144
-
145
-
146
-
147
-
148
-
149
-
150
-
151
-
152
-
153
-
154
-
155
-
156
-
157
-
158
-
159
-
160
-
161
-
162
-
163
-
164
-
165
-
166
-
167
-
168
-
169
-
170
-
171
-
172
-
173
-
174
-
175
-
176
-
177
-
178
-
179
-
180
-
181
-
182
-
183
-
184
-
185
-
186
-
187
-
188
-
189
-
190
-
191
-
192
-
193
-
194
-
195
-
196
-
197
-
198
-
199
-
200
-
201
-
202
-
203
-
204
-
205
-
206
-
207
-
208
-
209
-
210
-
211
-
212
-
213
-
214
-
215
-
216
-
217
-
218
-
219
-
220
-
221
-
222
-
223
-
224
-
225
-
226
-
227
-
228
-
229
-
230
-
231
-
232
-
233
-
234
-
235
-
236
-
237
-
238
-
239
-
240
-
241
-
242
-
243
-
244
-
245
-
246
-
247
-
248
-
249
-
250
-
251
-
252
-
253
-
254
-
255
-
256
-
257
-
258
-
259
-
260
-
261
-
262
-
263
-
264
-
265
-
266
-
267
-
268
 |
 |
Further discussion of reserve estimates For further discussion of these estimates and quantification of the impact of
reserve estimates, reserve reestimates and assumptions, see Notes 8 and 14 to the consolidated financial statements
and the Property-Liability Claims and Claims Expense Reserves section of this document.
Reserve for life-contingent contract benefits estimation Due to the long term nature of traditional life insurance,
life-contingent immediate annuities and voluntary accident and health products, benefits are payable over many years;
accordingly, the reserves are calculated as the present value of future expected benefits to be paid, reduced by the
present value of future expected net premiums. Long-term actuarial assumptions of future investment yields, mortality,
morbidity, policy terminations and expenses are used when establishing the reserve for life-contingent contract benefits
payable under these insurance policies. These assumptions, which for traditional life insurance are applied using the net
level premium method, include provisions for adverse deviation and generally vary by characteristics such as type of
coverage, year of issue and policy duration. Future investment yield assumptions are determined based upon prevailing
investment yields as well as estimated reinvestment yields. Mortality, morbidity and policy termination assumptions are
based on our experience and industry experience. Expense assumptions include the estimated effects of inflation and
expenses to be incurred beyond the premium-paying period. These assumptions are established at the time the policy is
issued, are consistent with assumptions for determining DAC amortization for these policies, and are generally not
changed during the policy coverage period. However, if actual experience emerges in a manner that is significantly
adverse relative to the original assumptions, adjustments to DAC or reserves may be required resulting in a charge to
earnings which could have a material effect on our operating results and financial condition. We periodically review the
adequacy of reserves and recoverability of DAC for these policies on an aggregate basis using actual experience. In the
event actual experience is significantly adverse compared to the original assumptions and a premium deficiency is
determined to exist, any remaining unamortized DAC balance must be expensed to the extent not recoverable and the
establishment of a premium deficiency reserve may be required. In 2011, 2010 and 2009, our reviews concluded that no
premium deficiency adjustments were necessary, primarily due to profit from traditional life insurance more than
offsetting the projected losses in immediate annuities with life contingencies. We will continue to monitor the
experience of our traditional life insurance and immediate annuities. We anticipate that mortality, investment and
reinvestment yields, and policy terminations are the factors that would be most likely to require premium deficiency
adjustments to these reserves or related DAC.
For further detail on the reserve for life-contingent contract benefits, see Note 9 of the consolidated financial
statements.
PROPERTY-LIABILITY 2011 HIGHLIGHTS
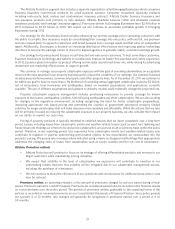
• Premiums written, an operating measure that is defined and reconciled to premiums earned in the Property-Liability
Operations section of the MD&A, increased 0.3% to $25.98 billion in 2011 from $25.91 billion in 2010.
– Allstate brand standard auto premiums written decreased 0.9% to $15.70 billion in 2011 from $15.84 billion in
2010.
– Allstate brand homeowners premiums written increased 2.4% to $5.89 billion in 2011 from $5.75 billion in
2010.
– Encompass brand premiums written decreased 3.6% to $1.06 billion in 2011 from $1.10 billion 2010.
– Esurance brand premiums written were $181 million in 2011 for the period from the October 7, 2011 acquisition
date to December 31, 2011.
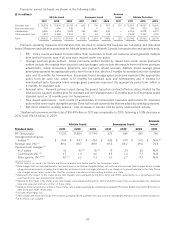
• Premium operating measures and statistics contributing to overall Allstate brand standard auto premiums written
decrease were the following:
– 1.5% decrease in PIF as of December 31, 2011 compared to December 31, 2010
– 0.2% increase in the six month policy term average gross premium before reinsurance to $444 in 2011 from
$443 in 2010
– 0.3 point increase in the six month renewal ratio to 89.0% in 2011 compared to 88.7% in 2010
– 5.8% decrease in new issued applications in 2011 compared to 2010
• Premium operating measures and statistics contributing to overall Allstate brand homeowners premiums written
increase were the following:
– 4.8% decrease in PIF as of December 31, 2011 compared to December 31, 2010
– 5.9% increase in the twelve month policy term average gross premium before reinsurance to $999 in 2011 from
$943 in 2010
– 0.1 point decrease in the twelve month renewal ratio to 88.3% in 2011 compared to 88.4% in 2010
– 14.9% decrease in new issued applications in 2011 compared to 2010
– $39 million decrease in catastrophe reinsurance costs to $495 million in 2011 from $534 million in 2010
26