Allstate 2012 Annual Report Download - page 264
Download and view the complete annual report
Please find page 264 of the 2012 Allstate annual report below. You can navigate through the pages in the report by either clicking on the pages listed below, or by using the keyword search tool below to find specific information within the annual report.-
 1
1 -
2
-
3
-
4
-
5
-
6
-
7
-
8
-
9
-
10
-
11
-
12
-
13
-
14
-
15
-
16
-
17
-
18
-
19
-
20
-
21
-
22
-
23
-
24
-
25
-
26
-
27
-
28
-
29
-
30
-
31
-
32
-
33
-
34
-
35
-
36
-
37
-
38
-
39
-
40
-
41
-
42
-
43
-
44
-
45
-
46
-
47
-
48
-
49
-
50
-
51
-
52
-
53
-
54
-
55
-
56
-
57
-
58
-
59
-
60
-
61
-
62
-
63
-
64
-
65
-
66
-
67
-
68
-
69
-
70
-
71
-
72
-
73
-
74
-
75
-
76
-
77
-
78
-
79
-
80
-
81
-
82
-
83
-
84
-
85
-
86
-
87
-
88
-
89
-
90
-
91
-
92
-
93
-
94
-
95
-
96
-
97
-
98
-
99
-
100
-
101
-
102
-
103
-
104
-
105
-
106
-
107
-
108
-
109
-
110
-
111
-
112
-
113
-
114
-
115
-
116
-
117
-
118
-
119
-
120
-
121
-
122
-
123
-
124
-
125
-
126
-
127
-
128
-
129
-
130
-
131
-
132
-
133
-
134
-
135
-
136
-
137
-
138
-
139
-
140
-
141
-
142
-
143
-
144
-
145
-
146
-
147
-
148
-
149
-
150
-
151
-
152
-
153
-
154
-
155
-
156
-
157
-
158
-
159
-
160
-
161
-
162
-
163
-
164
-
165
-
166
-
167
-
168
-
169
-
170
-
171
-
172
-
173
-
174
-
175
-
176
-
177
-
178
-
179
-
180
-
181
-
182
-
183
-
184
-
185
-
186
-
187
-
188
-
189
-
190
-
191
-
192
-
193
-
194
-
195
-
196
-
197
-
198
-
199
-
200
-
201
-
202
-
203
-
204
-
205
-
206
-
207
-
208
-
209
-
210
-
211
-
212
-
213
-
214
-
215
-
216
-
217
-
218
-
219
-
220
-
221
-
222
-
223
-
224
-
225
-
226
-
227
-
228
-
229
-
230
-
231
-
232
-
233
-
234
-
235
-
236
-
237
-
238
-
239
-
240
-
241
-
242
-
243
-
244
-
245
-
246
-
247
-
248
-
249
-
250
-
251
-
252
-
253
-
 254
254 -
 255
255 -
 256
256 -
 257
257 -
 258
258 -
 259
259 -
 260
260 -
 261
261 -
 262
262 -
 263
263 -
 264
264 -
 265
265 -
 266
266 -
 267
267 -
 268
268
 |
 |

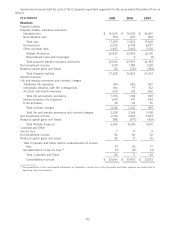
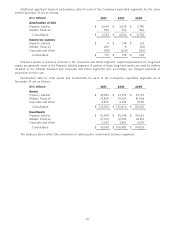
20. Other Comprehensive Income
The components of other comprehensive income on a pre-tax and after-tax basis for the years ended December 31
are as follows:
2011 2010 2009
($ in millions)
Pre- After- Pre- After- Pre- After-
tax Tax tax tax Tax tax tax Tax tax
Unrealized net holding
gains arising during the
period, net of related
offsets $ 1,455 $ (510) $ 945 $ 2,523 $ (882) $ 1,641 $ 5,015 $ (1,754) $ 3,261
Less: reclassification
adjustment of realized
capital gains and losses 795 (278) 517 (221) 77 (144) (284) 99 (185)
Unrealized net capital
gains and losses 660 (232) 428 2,744 (959) 1,785 5,299 (1,853) 3,446
Unrealized foreign
currency translation
adjustments (18) 6 (12) 35 (12) 23 63 (22) 41
Unrecognized pension and
other postretirement
benefit cost (371) 132 (239) 142 (48) 94 (292) 78 (214)
Other comprehensive
income $ 271 $ (94) $ 177 $ 2,921 $ (1,019) $ 1,902 $ 5,070 $ (1,797) $ 3,273
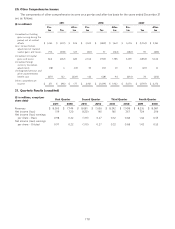
21. Quarterly Results (unaudited)
($ in millions, except per First Quarter Second Quarter Third Quarter Fourth Quarter
share data)
2011 2010 2011 2010 2011 2010 2011 2010
Revenues $ 8,095 $ 7,749 $ 8,081 $ 7,656 $ 8,242 $ 7,908 $ 8,236 $ 8,087
Net income (loss) 519 120 (620) 145 165 367 724 296
Net income (loss) earnings
per share – Basic 0.98 0.22 (1.19) 0.27 0.32 0.68 1.44 0.55
Net income (loss) earnings
per share – Diluted 0.97 0.22 (1.19) 0.27 0.32 0.68 1.43 0.55
178