Allstate 2012 Annual Report Download - page 122
Download and view the complete annual report
Please find page 122 of the 2012 Allstate annual report below. You can navigate through the pages in the report by either clicking on the pages listed below, or by using the keyword search tool below to find specific information within the annual report.-
 1
1 -
2
-
3
-
4
-
5
-
6
-
7
-
8
-
9
-
10
-
11
-
12
-
13
-
14
-
15
-
16
-
17
-
18
-
19
-
20
-
21
-
22
-
23
-
24
-
25
-
26
-
27
-
28
-
29
-
30
-
31
-
32
-
33
-
34
-
35
-
36
-
37
-
38
-
39
-
40
-
41
-
42
-
43
-
44
-
45
-
46
-
47
-
48
-
49
-
50
-
51
-
52
-
53
-
54
-
55
-
56
-
57
-
58
-
59
-
60
-
61
-
62
-
63
-
64
-
65
-
66
-
67
-
68
-
69
-
70
-
71
-
72
-
73
-
74
-
75
-
76
-
77
-
78
-
79
-
80
-
81
-
82
-
83
-
84
-
85
-
86
-
87
-
88
-
89
-
90
-
91
-
92
-
93
-
94
-
95
-
96
-
97
-
98
-
99
-
100
-
101
-
102
-
103
-
104
-
105
-
106
-
107
-
108
-
109
-
110
-
111
-
 112
112 -
 113
113 -
 114
114 -
 115
115 -
 116
116 -
 117
117 -
 118
118 -
 119
119 -
 120
120 -
 121
121 -
 122
122 -
 123
123 -
 124
124 -
 125
125 -
 126
126 -
 127
127 -
 128
128 -
 129
129 -
 130
130 -
 131
131 -
 132
132 -
133
-
134
-
135
-
136
-
137
-
138
-
139
-
140
-
141
-
142
-
143
-
144
-
145
-
146
-
147
-
148
-
149
-
150
-
151
-
152
-
153
-
154
-
155
-
156
-
157
-
158
-
159
-
160
-
161
-
162
-
163
-
164
-
165
-
166
-
167
-
168
-
169
-
170
-
171
-
172
-
173
-
174
-
175
-
176
-
177
-
178
-
179
-
180
-
181
-
182
-
183
-
184
-
185
-
186
-
187
-
188
-
189
-
190
-
191
-
192
-
193
-
194
-
195
-
196
-
197
-
198
-
199
-
200
-
201
-
202
-
203
-
204
-
205
-
206
-
207
-
208
-
209
-
210
-
211
-
212
-
213
-
214
-
215
-
216
-
217
-
218
-
219
-
220
-
221
-
222
-
223
-
224
-
225
-
226
-
227
-
228
-
229
-
230
-
231
-
232
-
233
-
234
-
235
-
236
-
237
-
238
-
239
-
240
-
241
-
242
-
243
-
244
-
245
-
246
-
247
-
248
-
249
-
250
-
251
-
252
-
253
-
254
-
255
-
256
-
257
-
258
-
259
-
260
-
261
-
262
-
263
-
264
-
265
-
266
-
267
-
268
 |
 |

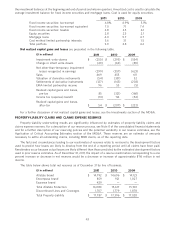
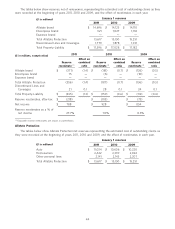
We have different plans around the country to improve the growth and profitability of our homeowners business. In
states where we offer homeowners and other property coverages that do not have severe weather issues and that have
acceptable returns, we are seeking to grow. In another group of states where we offer homeowners and other property
coverages, we plan to implement pricing and/or underwriting actions that will improve performance to achieve our
profitability targets. For two other groups of states, including those with severe weather issues and other risks such as
hurricane exposure, we may take more substantial actions including raising prices, offering policies with more limited
coverage, or brokering to other carriers. We are currently piloting our Allstate House and HomeSM product which
provides greater options of coverage for roof damage including depreciated value versus replacement value and uses a
number of factors to determine price, some of which relate to auto insurance risks. We expect to roll it out countrywide
for new business gradually over the next three years.
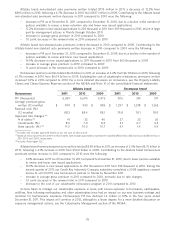
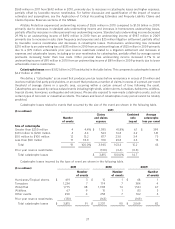
Allstate brand homeowners premiums written increased in 2010 compared to 2009. Contributing to the Allstate
brand homeowners premiums written increase in 2010 compared to 2009 were the following:
– 4.1% decrease in PIF as of December 31, 2010 compared to December 31, 2009, following a 3.9% decrease as
of December 31, 2009 compared to December 31, 2008, due to fewer policies available to renew and fewer
new issued applications
– 3.6% decrease in new issued applications to 536 thousand in 2010 from 556 thousand in 2009. Excluding
Florida, new issued applications on a countrywide basis decreased 12.4% to 487 thousand in 2010 from
556 thousand in 2009.
– increase in average gross premium in 2010 compared to 2009, primarily due to rate changes
– 0.3 point increase in the renewal ratio in 2010 compared to 2009
– decrease in the net cost of our catastrophe reinsurance program in 2010 compared to 2009
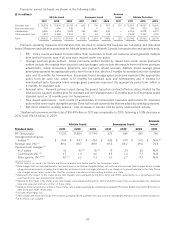
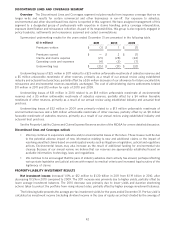
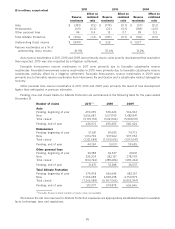
Underwriting results are shown in the following table.
($ in millions) 2011 2010 2009
Premiums written $ 25,981 $ 25,906 $ 25,972
Premiums earned $ 25,942 $ 25,955 $ 26,195
Claims and claims expense (20,140) (18,923) (18,722)
Amortization of DAC (3,640) (3,678) (3,789)
Other costs and expenses (2,968) (2,795) (2,552)
Restructuring and related charges (43) (33) (105)
Underwriting (loss) income $ (849) $ 526 $ 1,027
Catastrophe losses $ 3,815 $ 2,207 $ 2,069
Underwriting income (loss) by line of business
Standard auto $ 568 $ 692 $ 987
Non-standard auto 101 74 76
Homeowners (1,330) (335) (125)
Other personal lines (188) 95 89
Underwriting (loss) income $ (849) $ 526 $ 1,027
Underwriting income (loss) by brand
Allstate brand $ (666) $ 569 $ 1,022
Encompass brand (146) (43) 5
Esurance brand (37) — —
Underwriting (loss) income $ (849) $ 526 $ 1,027
Allstate Protection experienced an underwriting loss of $849 million in 2011 compared to underwriting income of
$526 million in 2010, primarily due to an increase in homeowners underwriting loss, an underwriting loss for other
personal lines compared to an underwriting gain in the prior year, and a decrease in standard auto underwriting income.
Homeowners underwriting loss increased $995 million to $1.33 billion in 2011 from $335 million in 2010, primarily due
to increases in catastrophe losses and higher expenses partially offset by average earned premiums increasing faster
than loss costs. Other personal lines underwriting income decreased $283 million to an underwriting loss of
$188 million in 2011 from underwriting income of $95 million in 2010, primarily due to increases in catastrophe losses,
unfavorable reserve reestimates and higher expenses. Standard auto underwriting income decreased $124 million to
36