Allstate 2012 Annual Report Download - page 166
Download and view the complete annual report
Please find page 166 of the 2012 Allstate annual report below. You can navigate through the pages in the report by either clicking on the pages listed below, or by using the keyword search tool below to find specific information within the annual report.-
 1
1 -
2
-
3
-
4
-
5
-
6
-
7
-
8
-
9
-
10
-
11
-
12
-
13
-
14
-
15
-
16
-
17
-
18
-
19
-
20
-
21
-
22
-
23
-
24
-
25
-
26
-
27
-
28
-
29
-
30
-
31
-
32
-
33
-
34
-
35
-
36
-
37
-
38
-
39
-
40
-
41
-
42
-
43
-
44
-
45
-
46
-
47
-
48
-
49
-
50
-
51
-
52
-
53
-
54
-
55
-
56
-
57
-
58
-
59
-
60
-
61
-
62
-
63
-
64
-
65
-
66
-
67
-
68
-
69
-
70
-
71
-
72
-
73
-
74
-
75
-
76
-
77
-
78
-
79
-
80
-
81
-
82
-
83
-
84
-
85
-
86
-
87
-
88
-
89
-
90
-
91
-
92
-
93
-
94
-
95
-
96
-
97
-
98
-
99
-
100
-
101
-
102
-
103
-
104
-
105
-
106
-
107
-
108
-
109
-
110
-
111
-
112
-
113
-
114
-
115
-
116
-
117
-
118
-
119
-
120
-
121
-
122
-
123
-
124
-
125
-
126
-
127
-
128
-
129
-
130
-
131
-
132
-
133
-
134
-
135
-
136
-
137
-
138
-
139
-
140
-
141
-
142
-
143
-
144
-
145
-
146
-
147
-
148
-
149
-
150
-
151
-
152
-
153
-
154
-
155
-
 156
156 -
 157
157 -
 158
158 -
 159
159 -
 160
160 -
 161
161 -
 162
162 -
 163
163 -
 164
164 -
 165
165 -
 166
166 -
 167
167 -
 168
168 -
 169
169 -
 170
170 -
 171
171 -
 172
172 -
 173
173 -
 174
174 -
 175
175 -
 176
176 -
177
-
178
-
179
-
180
-
181
-
182
-
183
-
184
-
185
-
186
-
187
-
188
-
189
-
190
-
191
-
192
-
193
-
194
-
195
-
196
-
197
-
198
-
199
-
200
-
201
-
202
-
203
-
204
-
205
-
206
-
207
-
208
-
209
-
210
-
211
-
212
-
213
-
214
-
215
-
216
-
217
-
218
-
219
-
220
-
221
-
222
-
223
-
224
-
225
-
226
-
227
-
228
-
229
-
230
-
231
-
232
-
233
-
234
-
235
-
236
-
237
-
238
-
239
-
240
-
241
-
242
-
243
-
244
-
245
-
246
-
247
-
248
-
249
-
250
-
251
-
252
-
253
-
254
-
255
-
256
-
257
-
258
-
259
-
260
-
261
-
262
-
263
-
264
-
265
-
266
-
267
-
268
 |
 |

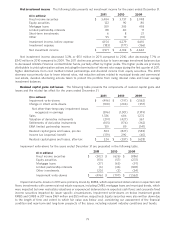
Impairment write-downs in 2010 were primarily driven by RMBS, which experienced deterioration in expected cash
flows; investments with commercial real estate exposure, including CMBS, mortgage loans, limited partnership interests
and certain housing related municipal bonds, which were impacted by lower real estate valuations or experienced
deterioration in expected cash flows; and privately placed corporate bonds and municipal bonds impacted by issuer
specific circumstances. Impairment write-downs on below investment grade RMBS, CMBS and ABS in 2010 were
$332 million, $118 million and $29 million, respectively.
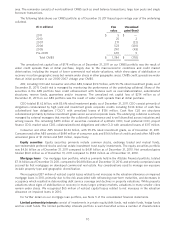
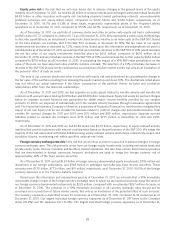
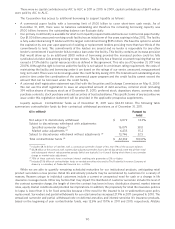
Change in intent write-downs for the years ended December 31 are presented in the following table.
2011 2010 2009
($ in millions)
Fixed income securities $ (92) $ (198) $ (318)
Equity securities (8) — (27)
Mortgage loans — (6) (6)
Other investments — — (6)
Change in intent write-downs $ (100) $ (204) $ (357)
The change in intent write-downs in 2011 were primarily a result of ongoing comprehensive reviews of our portfolios
resulting in write-downs of individually identified investments, primarily lower yielding, floating rate RMBS and
municipal bonds, and equity securities. The change in intent write-downs in 2010 were primarily a result of ongoing
comprehensive reviews of our portfolios resulting in write-downs of individually identified investments, primarily
municipal bonds and RMBS.
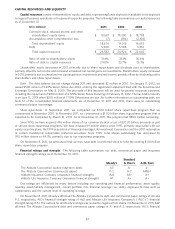
Sales generated $1.34 billion of net realized gains in 2011 primarily due to $1.11 billion of net gains on sales of
corporate, foreign government, U.S. government, ABS, U.S. Agency and municipal fixed income securities and
$202 million of net gains on sales of equity securities. During the second half of 2011, interest rates were at historical
lows and we capitalized on valuation gains on fixed income securities through $8.49 billion in sales generating
$750 million of realized capital gains. Net realized gains from sales of $686 million in 2010 were primarily due to
$595 million of net gains on sales of corporate, U.S. government, foreign government and municipal fixed income
securities and $210 million of net gains on sales of equity securities, partially offset by $139 million of net losses on sales
of CMBS and ABS.
Valuation and settlements of derivative instruments net realized capital losses totaling $396 million in 2011 included
$291 million of losses on the valuation of derivative instruments and $105 million of losses on the settlement of
derivative instruments. The net realized capital losses on derivative instruments in 2011 primarily included losses on
interest rate risk management due to decreases in interest rates. In 2010, net realized capital losses on the valuation and
settlement of derivative instruments totaled $601 million. As a component of our approach to managing interest rate
risk, realized gains and losses on certain derivative instruments are most appropriately considered in conjunction with
the unrealized gains and losses on the fixed income portfolio. This approach mitigates the impacts of general interest
rate changes to our overall financial condition.
MARKET RISK
Market risk is the risk that we will incur losses due to adverse changes in interest rates, credit spreads, equity prices
or currency exchange rates. Adverse changes to these rates and prices may occur due to changes in fiscal policy, the
economic climate, the liquidity of a market or market segment, insolvency or financial distress of key market makers or
participants or changes in market perceptions of credit worthiness and/or risk tolerance. Our primary market risk
exposures are to changes in interest rates, credit spreads and equity prices.
The active management of market risk is integral to our results of operations. We may use the following approaches
to manage exposure to market risk within defined tolerance ranges: 1) rebalancing existing asset or liability portfolios,
2) changing the character of investments purchased in the future and 3) using derivative instruments to modify the
market risk characteristics of existing assets and liabilities or assets expected to be purchased. For a more detailed
discussion of our use of derivative financial instruments, see Note 7 of the consolidated financial statements.
Overview In formulating and implementing guidelines for investing funds, we seek to earn returns that enhance
our ability to offer competitive rates and prices to customers while contributing to attractive and stable profits and
long-term capital growth. Accordingly, our investment decisions and objectives are a function of the underlying risks
and product profiles of each business.
Investment policies define the overall framework for managing market and other investment risks, including
accountability and controls over risk management activities. Subsidiaries that conduct investment activities follow
80