Allstate 2012 Annual Report Download - page 253
Download and view the complete annual report
Please find page 253 of the 2012 Allstate annual report below. You can navigate through the pages in the report by either clicking on the pages listed below, or by using the keyword search tool below to find specific information within the annual report.-
 1
1 -
2
-
3
-
4
-
5
-
6
-
7
-
8
-
9
-
10
-
11
-
12
-
13
-
14
-
15
-
16
-
17
-
18
-
19
-
20
-
21
-
22
-
23
-
24
-
25
-
26
-
27
-
28
-
29
-
30
-
31
-
32
-
33
-
34
-
35
-
36
-
37
-
38
-
39
-
40
-
41
-
42
-
43
-
44
-
45
-
46
-
47
-
48
-
49
-
50
-
51
-
52
-
53
-
54
-
55
-
56
-
57
-
58
-
59
-
60
-
61
-
62
-
63
-
64
-
65
-
66
-
67
-
68
-
69
-
70
-
71
-
72
-
73
-
74
-
75
-
76
-
77
-
78
-
79
-
80
-
81
-
82
-
83
-
84
-
85
-
86
-
87
-
88
-
89
-
90
-
91
-
92
-
93
-
94
-
95
-
96
-
97
-
98
-
99
-
100
-
101
-
102
-
103
-
104
-
105
-
106
-
107
-
108
-
109
-
110
-
111
-
112
-
113
-
114
-
115
-
116
-
117
-
118
-
119
-
120
-
121
-
122
-
123
-
124
-
125
-
126
-
127
-
128
-
129
-
130
-
131
-
132
-
133
-
134
-
135
-
136
-
137
-
138
-
139
-
140
-
141
-
142
-
143
-
144
-
145
-
146
-
147
-
148
-
149
-
150
-
151
-
152
-
153
-
154
-
155
-
156
-
157
-
158
-
159
-
160
-
161
-
162
-
163
-
164
-
165
-
166
-
167
-
168
-
169
-
170
-
171
-
172
-
173
-
174
-
175
-
176
-
177
-
178
-
179
-
180
-
181
-
182
-
183
-
184
-
185
-
186
-
187
-
188
-
189
-
190
-
191
-
192
-
193
-
194
-
195
-
196
-
197
-
198
-
199
-
200
-
201
-
202
-
203
-
204
-
205
-
206
-
207
-
208
-
209
-
210
-
211
-
212
-
213
-
214
-
215
-
216
-
217
-
218
-
219
-
220
-
221
-
222
-
223
-
224
-
225
-
226
-
227
-
228
-
229
-
230
-
231
-
232
-
233
-
234
-
235
-
236
-
237
-
238
-
239
-
240
-
241
-
242
-
 243
243 -
 244
244 -
 245
245 -
 246
246 -
 247
247 -
 248
248 -
 249
249 -
 250
250 -
 251
251 -
 252
252 -
 253
253 -
 254
254 -
 255
255 -
 256
256 -
 257
257 -
 258
258 -
 259
259 -
 260
260 -
 261
261 -
 262
262 -
 263
263 -
264
-
265
-
266
-
267
-
268
 |
 |

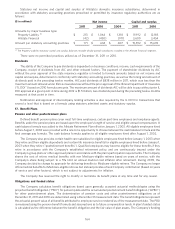
Weighted average assumptions used to determine benefit obligations as of December 31 are listed in the following
table.
Pension benefits Postretirement benefits
2011 2010 2011 2010
Discount rate 5.25% 6.00% 5.25% 6.00%
Rate of increase in compensation levels 4.0 - 4.5 4.0 - 4.5 n/a n/a
The weighted average health care cost trend rate used in measuring the accumulated postretirement benefit cost is
7.30% for 2012, gradually declining to 4.5% in 2024 and remaining at that level thereafter.
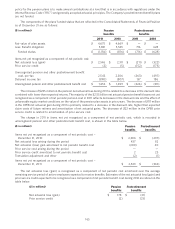
Assumed health care cost trend rates have a significant effect on the amounts reported for the postretirement
health care plans. A one percentage-point increase in assumed health care cost trend rates would increase the total of
the service and interest cost components of net periodic benefit cost of other postretirement benefits and the APBO by
$3 million and $27 million, respectively. A one percentage-point decrease in assumed health care cost trend rates would
decrease the total of the service and interest cost components of net periodic benefit cost of other postretirement
benefits and the APBO by $2 million and $21 million, respectively.
Pension plan assets
The change in pension plan assets for the years ended December 31 is as follows:
($ in millions) 2011 2010
Fair value of plan assets, beginning of year $ 4,669 $ 4,127
Actual return on plan assets 267 496
Employer contribution 264 443
Benefits paid (511) (407)
Translation adjustment and other (14) 10
Fair value of plan assets, end of year $ 4,675 $ 4,669
In general, the Company’s pension plan assets are managed in accordance with investment policies approved by
pension investment committees. The purpose of the policies is to ensure the plans’ long-term ability to meet benefit
obligations by prudently investing plan assets and Company contributions, while taking into consideration regulatory
and legal requirements and current market conditions. The investment policies are reviewed periodically and specify
target plan asset allocation by asset category. In addition, the policies specify various asset allocation and other risk
limits. The pension plans’ asset exposure within each asset category is tracked against widely accepted established
benchmarks for each asset class with limits on variation from the benchmark established in the investment policy.
Pension plan assets are regularly monitored for compliance with these limits and other risk limits specified in the
investment policies.
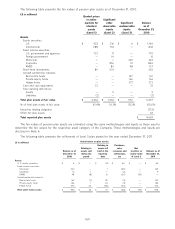
The pension plans’ target asset allocation and the actual percentage of plan assets, by asset category as of
December 31 are as follows:
Target asset Actual percentage
allocation of plan assets
Asset category 2011 2011 2010
U.S. equity securities 25 - 33% 19% 25%
International equity securities 17 - 23 24 18
Fixed income securities 35 - 48 38 38
Real estate funds 3 - 7 4 4
Private equity funds 3 - 7 4 3
Hedge funds 6 - 9 7 8
Short-term investments and other 1 - 3 4 4
Total (1) 100% 100%
(1) Securities lending collateral reinvestment is excluded from target and actual percentage of plan assets.
The target asset allocation for an asset category may be achieved either through direct investment holdings,
through replication using derivative instruments (e.g., futures or swaps) or net of hedges using derivative instruments to
167