Allstate 2012 Annual Report Download - page 184
Download and view the complete annual report
Please find page 184 of the 2012 Allstate annual report below. You can navigate through the pages in the report by either clicking on the pages listed below, or by using the keyword search tool below to find specific information within the annual report.-
 1
1 -
2
-
3
-
4
-
5
-
6
-
7
-
8
-
9
-
10
-
11
-
12
-
13
-
14
-
15
-
16
-
17
-
18
-
19
-
20
-
21
-
22
-
23
-
24
-
25
-
26
-
27
-
28
-
29
-
30
-
31
-
32
-
33
-
34
-
35
-
36
-
37
-
38
-
39
-
40
-
41
-
42
-
43
-
44
-
45
-
46
-
47
-
48
-
49
-
50
-
51
-
52
-
53
-
54
-
55
-
56
-
57
-
58
-
59
-
60
-
61
-
62
-
63
-
64
-
65
-
66
-
67
-
68
-
69
-
70
-
71
-
72
-
73
-
74
-
75
-
76
-
77
-
78
-
79
-
80
-
81
-
82
-
83
-
84
-
85
-
86
-
87
-
88
-
89
-
90
-
91
-
92
-
93
-
94
-
95
-
96
-
97
-
98
-
99
-
100
-
101
-
102
-
103
-
104
-
105
-
106
-
107
-
108
-
109
-
110
-
111
-
112
-
113
-
114
-
115
-
116
-
117
-
118
-
119
-
120
-
121
-
122
-
123
-
124
-
125
-
126
-
127
-
128
-
129
-
130
-
131
-
132
-
133
-
134
-
135
-
136
-
137
-
138
-
139
-
140
-
141
-
142
-
143
-
144
-
145
-
146
-
147
-
148
-
149
-
150
-
151
-
152
-
153
-
154
-
155
-
156
-
157
-
158
-
159
-
160
-
161
-
162
-
163
-
164
-
165
-
166
-
167
-
168
-
169
-
170
-
171
-
172
-
173
-
 174
174 -
 175
175 -
 176
176 -
 177
177 -
 178
178 -
 179
179 -
 180
180 -
 181
181 -
 182
182 -
 183
183 -
 184
184 -
 185
185 -
 186
186 -
 187
187 -
 188
188 -
 189
189 -
 190
190 -
 191
191 -
 192
192 -
 193
193 -
 194
194 -
195
-
196
-
197
-
198
-
199
-
200
-
201
-
202
-
203
-
204
-
205
-
206
-
207
-
208
-
209
-
210
-
211
-
212
-
213
-
214
-
215
-
216
-
217
-
218
-
219
-
220
-
221
-
222
-
223
-
224
-
225
-
226
-
227
-
228
-
229
-
230
-
231
-
232
-
233
-
234
-
235
-
236
-
237
-
238
-
239
-
240
-
241
-
242
-
243
-
244
-
245
-
246
-
247
-
248
-
249
-
250
-
251
-
252
-
253
-
254
-
255
-
256
-
257
-
258
-
259
-
260
-
261
-
262
-
263
-
264
-
265
-
266
-
267
-
268
 |
 |

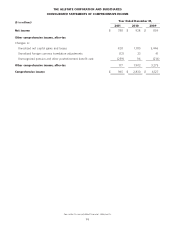
THE ALLSTATE CORPORATION AND SUBSIDIARIES
CONSOLIDATED STATEMENTS OF SHAREHOLDERS’ EQUITY
Year Ended December 31,
($ in millions, except per share data)
2011 2010 2009
Common stock $9$9$9
Additional capital paid-in
Balance, beginning of year 3,176 3,172 3,130
Equity incentive plans activity 13 4 42
Balance, end of year 3,189 3,176 3,172
Retained income
Balance, beginning of year 31,969 31,492 30,207
Net income 788 928 854
Dividends ($0.84, $0.80 and $0.80 per share) (436) (433) (432)
Cumulative effect of change in accounting principle — (18) 863
Balance, end of year 32,321 31,969 31,492
Deferred ESOP expense
Balance, beginning of year (44) (47) (49)
Payments 132
Balance, end of year (43) (44) (47)
Treasury stock
Balance, beginning of year (15,910) (15,828) (15,855)
Shares acquired (950) (166) (3)
Shares reissued under equity incentive plans, net 65 84 30
Balance, end of year (16,795) (15,910) (15,828)
Accumulated other comprehensive income
Balance, beginning of year (184) (2,106) (4,801)
Cumulative effect of change in accounting principle — 20 (578)
Change in unrealized net capital gains and losses 428 1,785 3,446
Change in unrealized foreign currency translation adjustments (12) 23 41
Change in unrecognized pension and other postretirement benefit cost (239) 94 (214)
Balance, end of year (7) (184) (2,106)
Total shareholders’ equity 18,674 19,016 16,692
Noncontrolling interest
Balance, beginning of year 28 29 32
Cumulative effect of change in accounting principle — 10 —
Change in noncontrolling interest ownership (4) (14) (3)
Noncontrolling gain 4 3 —
Balance, end of year 28 28 29
Total equity $ 18,702 $ 19,044 $ 16,721
See notes to consolidated financial statements.
98